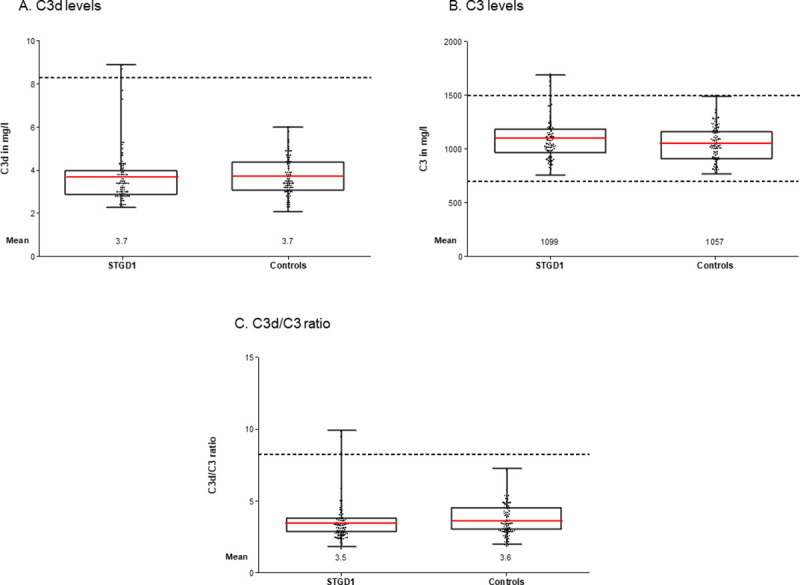
Fig 1. Complement activation levels in Stargardt disease (STGD1) patients and controls matched for age and sex.

Level of (A) C3d, (B) C3, (C) C3d/C3 ratio in STGD1 patients and controls. Dotted lines represent the reference values. Red lines represents the mean. There were no significant differences in means between patients and controls as tested with an independent samples t-test. C3, complement component 3; C3d, complement degradation product C3d.
