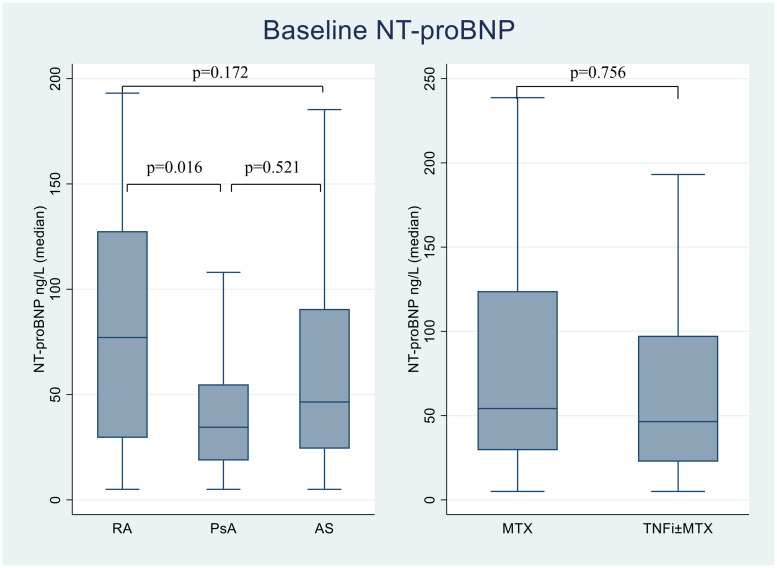
Fig 1. NT-proBNP at baseline.
Boxplots displaying the baseline values of NT-proBNP distributed according to diagnosis groups and therapy groups. The lines inside the boxes show the median, bottom and top of the box represent 25 and 75 percentile and whiskers represent minimum and maximum values. Values are given in median. NT-proBNP: N-terminal pro-brain natriuretic peptide, RA: Rheumatoid arthritis, PsA: Psoriatic arthritis, AS: Ankylosing spondylitis, MTX: Methotrexate, TNFi: Tumor necrosis factor inhibitors.

