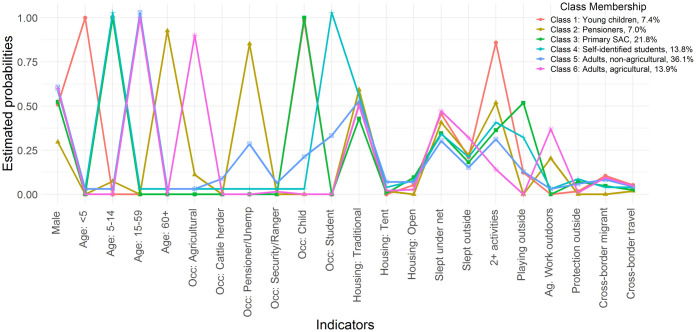
Fig 5. Profile plot of estimated indicator probabilities and latent class proportions for all six latent classes of malaria risk in a sample of malaria cases from Zambezi Region.
The item-response probabilities represent the probability of a positive response on a variable, given membership in a given class.

