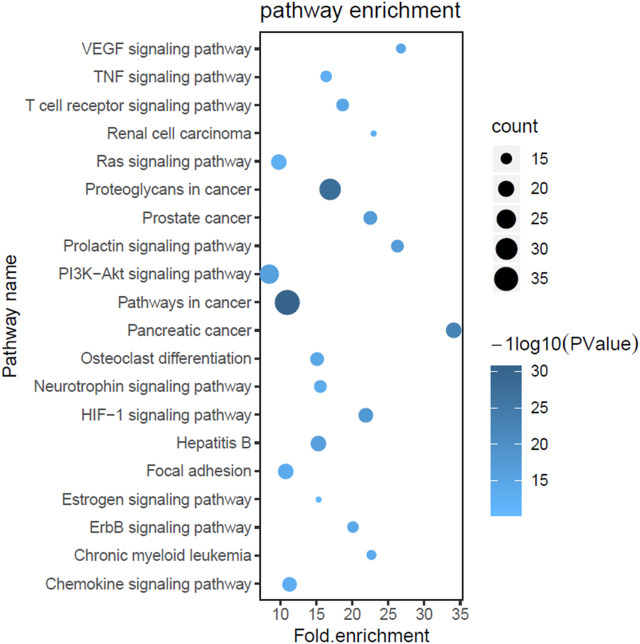
FIGURE 3.
Kyoto Encyclopedia of Genes and Genomes (KEGG) enrichment analysis. The X-axis represents the enrichment rate of these genes in total genes, while the Y-axis represents the enrichment pathways of the target genes (p-value ≤ 0.05). The depth of the color represents the size of the value, and the size of circle represents the enrichment counts of these pathways.

