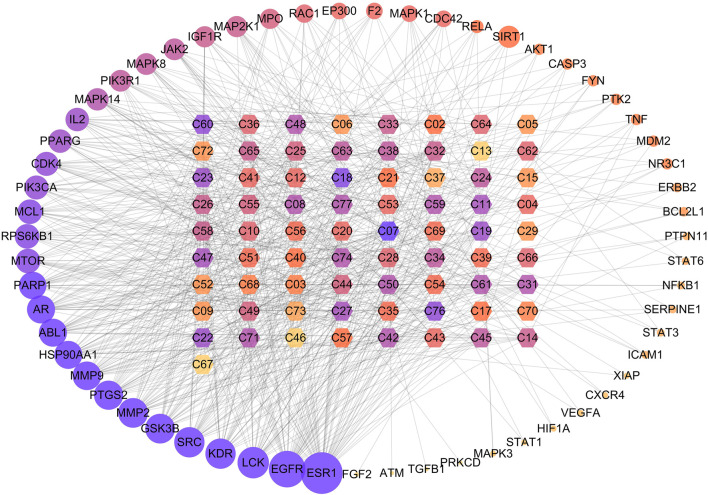
FIGURE 4.
The interaction network between compounds and hub targets. The hexagon represents the herbal compounds, the circles stand for the potential targets, and the edges represent the interactions between them. The depth of color and the size of circle are proportional to their degree value. The ID of the compounds was elaborated in Table 1.

