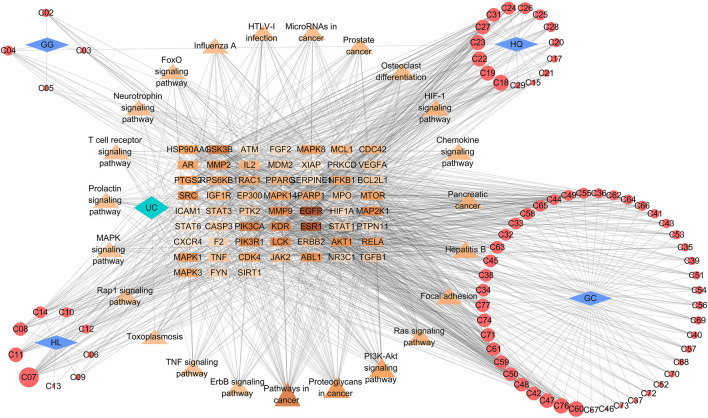
FIGURE 5.
Compound–target–pathway network. The rectangle, triangle and circle represent the potential targets, major pathways and botanical compounds, respectively. The rhombus represents the four botanical drugs in GQD. Edges represent the interaction between them. For the potential targets and pathways, the change in color depth reflect the degree value. For the botanical compounds, the circle size is proportional to their degree value. GG, Pueraria lobata (Willd.) Ohwi; HQ, Scutellaria baicalensis Georgi; HL, Coptis chinensis Franch; GC, Glycyrrhiza uralensis Fisch.

