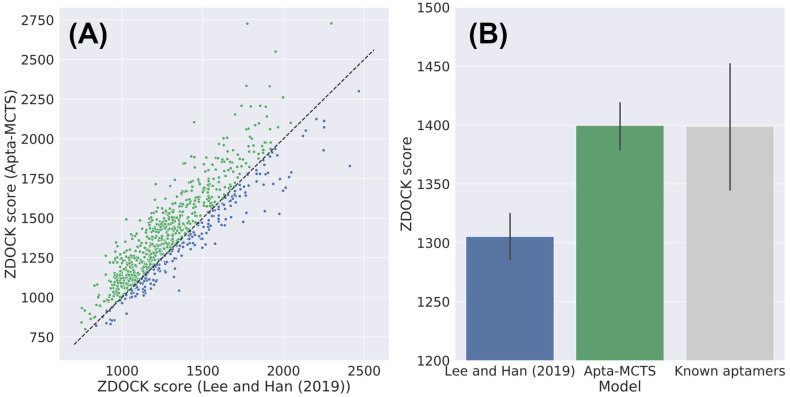
Fig 5. Binding affinity of aptamer samples that have same length with the known aptamers using the docking simulation score by ZDOCK.
(A) Comparison of docking scores between our Apta-MCTS and the method employed by Lee and Han [21]. The diagonal dashed line indicates that the docking scores of both models are tied. Green dots above the diagonal line refer to how Apta-MCTS generated better aptamers with higher docking scores than the method used by Lee and Han [21]. (B) Comparison with known aptamers. Apta-MCTS showed the highest docking scores for this comparison.

