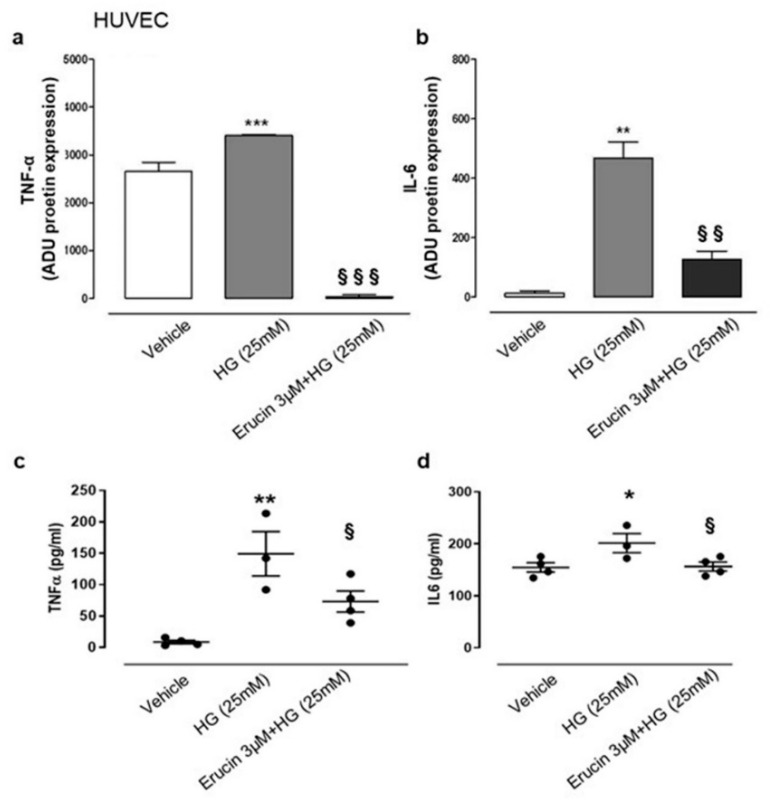
Figure 8.
Effects of erucin on inflammatory cytokines in HUVECs treated with HG. TNF-α (a) and IL-6 (b) measurement in cell lysates through cytokine array. TNF-α (c) and IL-6 (d) ELISA quanti-fication in cell supernatants. Each sample in (a,b) was used at a final concentration of 250 µg/mL. The graphs in (a,b) represent the quantification of the optical density of cytokines of interest, standardized towards vehicle. * p < 0.05 vs. vehicle; ** p < 0.01 vs. vehicle; *** p < 0.001 vs. vehicle; § p < 0.05 vs. HG (25 mM); §§ p < 0.01 vs. HG (25 mM); §§§ p < 0.001 vs. HG (25 mM).

