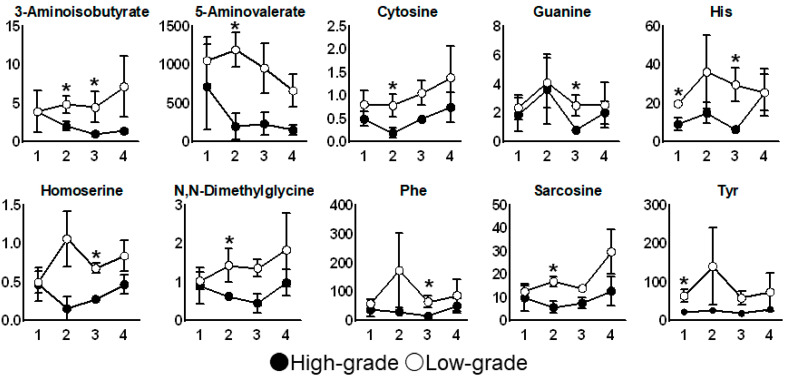
Figure 4.
Time course of metabolites showing significant differences in their concentration (Mann–Whitney test) at at least one time-point between the low- (open circle) and high-grade (filled circle) oral mucositis group. The mean and standard errors are shown. * p < 0.05. The x-axis indicates the sampling point described in Figure 1. The y-axis indicates the concentration of each metabolite (μM).

