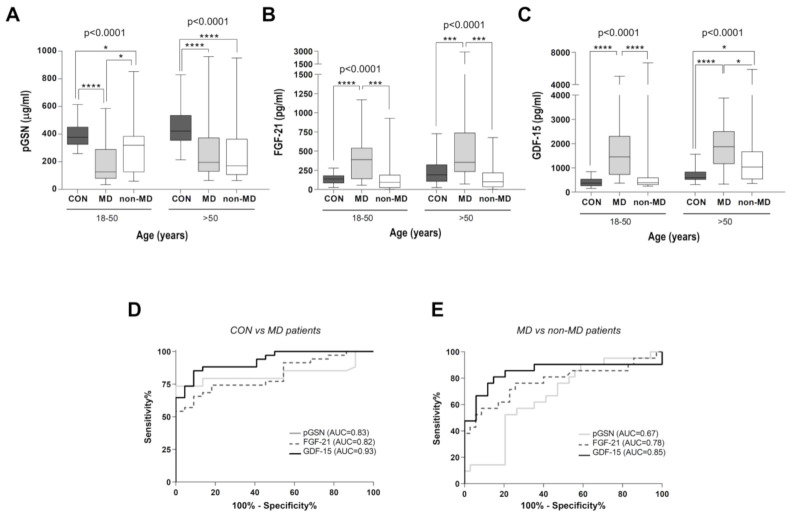
Figure 3.
Average plasma concentrations of pGSN, FGF-2, and GDF-15 according to age. For (A–C): Average concentrations of pGSN (B), FGF-21 (C), and GDF-15 (D) in controls (CON, n = 56), MD patients (n = 60), and non-MD patients (n = 41) based on their age ranges (either between 18–50 yrs, or >50 yrs). Data are presented as the median, interquartile range, minimum, and maximum. Kruskal–Wallis test p-values for the two groups (subjects between 18 and 50 and >50 yrs old) are indicated on top of the figures. Post hoc Mann–Whitney U test p-values: **** p < 0.00001, *** p < 0.0001, * p < 0.05. For (D,E): Comparative ROC curves for pGSN, FGF-21, and GDF-15 in the young study cohorts (subjects between 18 and 50 yrs). (D) ROC curve in MD patients vs. healthy controls. AUC values were 0.83 for pGSN (CI: 0.71–0.94), 0.82 for FGF-21 (CI: 0.71–0.93), and 0.93 for GDF-15 (CI: 0.86–0.99). (E) ROC curve in MD patients vs. non-MD patients. AUC values were 0.67 for pGSN (CI: 0.52–0.81), 0.78 for FGF-21 (CI: 0.64–0.92), and 0.85 for GDF-15 (CI: 0.72–0.98). AUC = area under the curve; ROC = receiver operating characteristic; CI: confidence interval.

