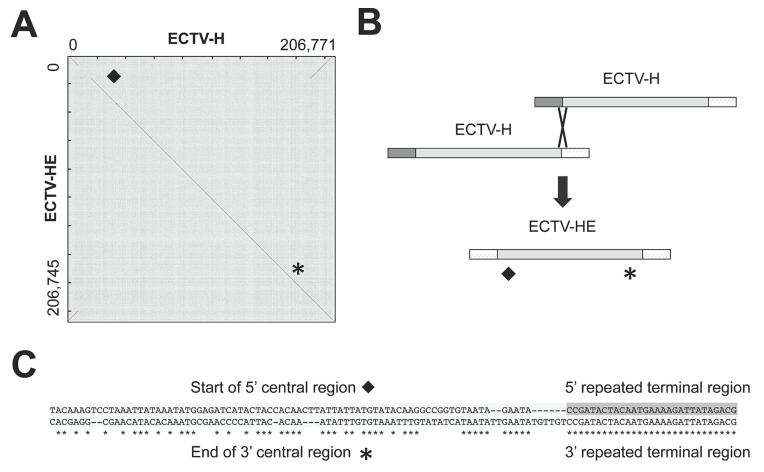
Figure 4.
Genomic comparison of ECTV-H and ECTV-HE. (A) Dot plot of ECTV-H vs. ECTV-HE. The dot plot compares two sequences by organizing one sequence on the x-axis, and another on the y-axis, of a plot. When the nt of both sequences match at the same location on the plot, a dot is drawn at the corresponding position. (B) Schematic representation of the proposed genomic recombination between two ECTV-H genomes to generate ECTV-HE. (C) Alignment of two representative reads that share the end of the repeated terminal region of ECTV-HE and differ in the beginning of the central region of the genome. An asterisk and a diamond indicate the approximated region where the aligned reads derived.

