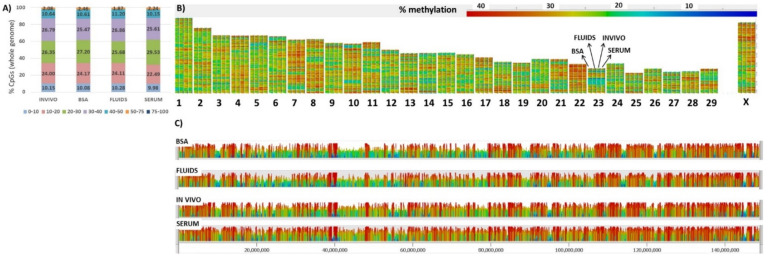
Figure 1.
(A) Distribution of methylation percentages across tiles of 100 CpGs on the bovine blastocyst by group. (B) Domainogram shows quantitation of the blastocyst methylation over the whole genome for each group (BSA, FLUIDS, INVIVO, SERUM) at every chromosome (1–29, X). (C) Browser shot of methylation landscape of the four groups analyzed (whole X-chromosome).

