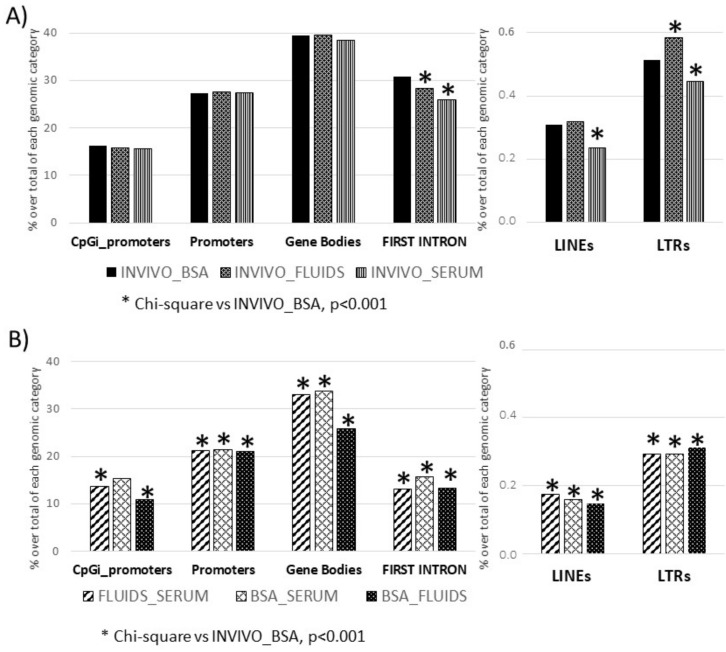
Figure 3.
Differentially methylated genomic features after targeted analysis. (A) Each invitro group (BSA, FLUIDS and SERUM) was compared vs. INVIVO group. Frequency distribution of DMTs in INVIVO vs. BSA was the reference for Chi-square analysis. (B) Differentially methylated genomic features for pair wise comparisons between in vitro groups.

