Figure 6.
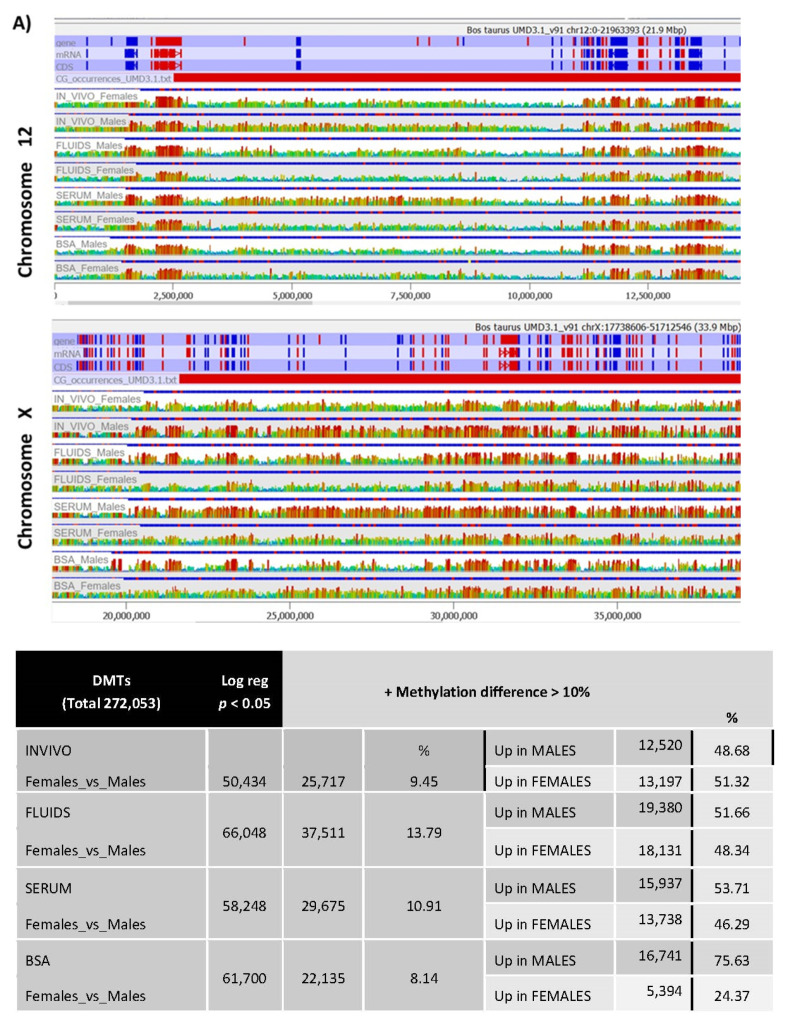
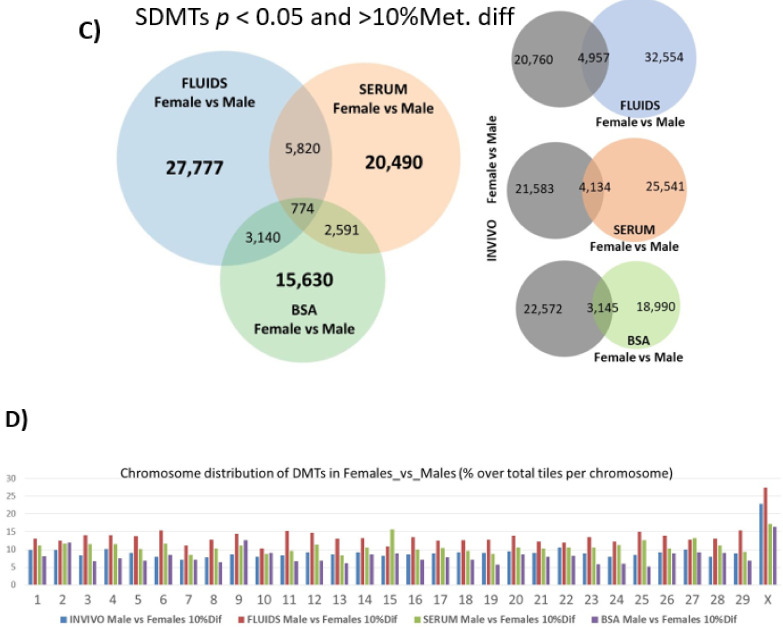
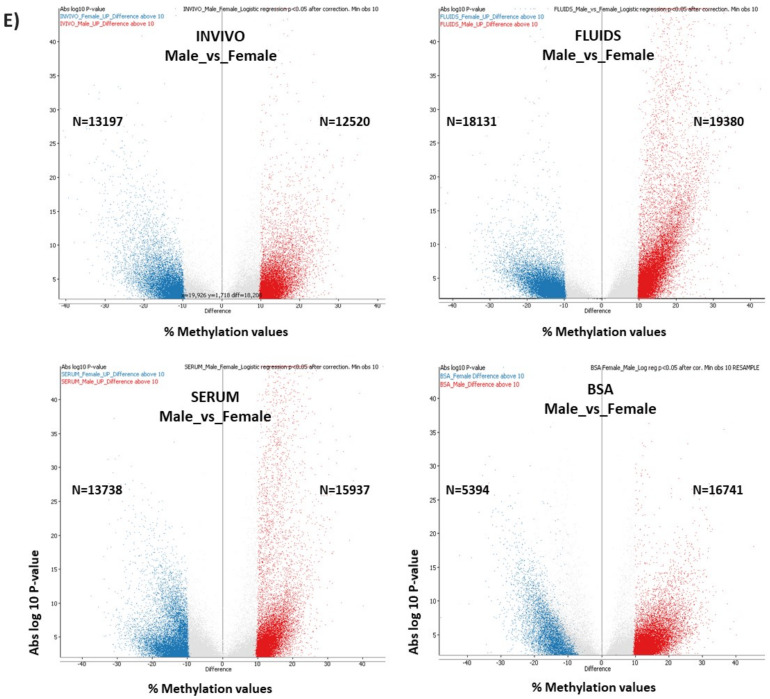
(A) Screenshot of Seqmonk genome browser at regions of Chromosome 12 and Chromosome X show examples of methylation differences between male and female blastocysts in each group and between groups. (B) DMTs of male and female blastocyts in each experimental group after logistic regression (p < 0.05). Indeed, these DMTs were filtered by methylation differences over 10% of methylation. (C) Venn diagrams show DMTs for each pair-wise comparison. (D) Percentage of DMTs over total tiles per chromosome in female vs. male blastocysts for each group. (E) Volcano Plots.


