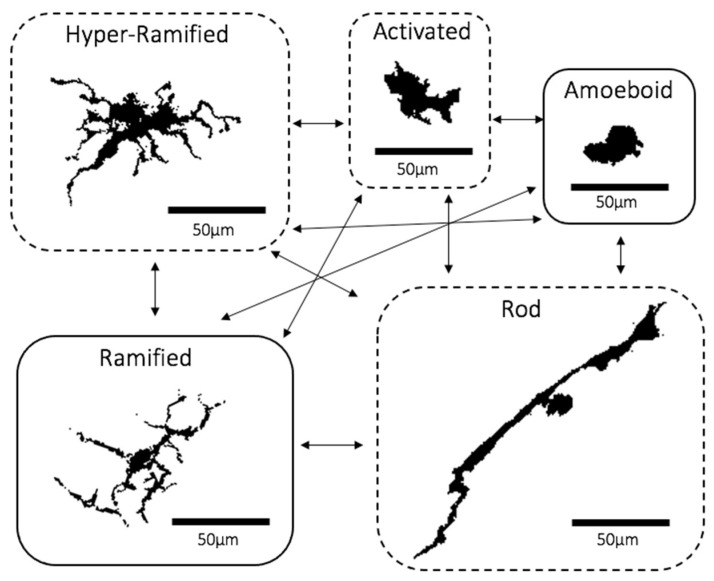
Figure 1.
Microglia Morphotypes. A diagram showing microglia morphotypes with arrows showing potential orders of morphotype modifications. Dashed boxes represent the “transitioning” microglia. Microglia are from whole-mount retinal images of iba-1-stained C57BL6 mouse (28 months old) retinal microglia. Scale bar = 50 μm. Images were obtained from the Cordeiro Laboratory following similar protocols mentioned in Davis et al. [24].

