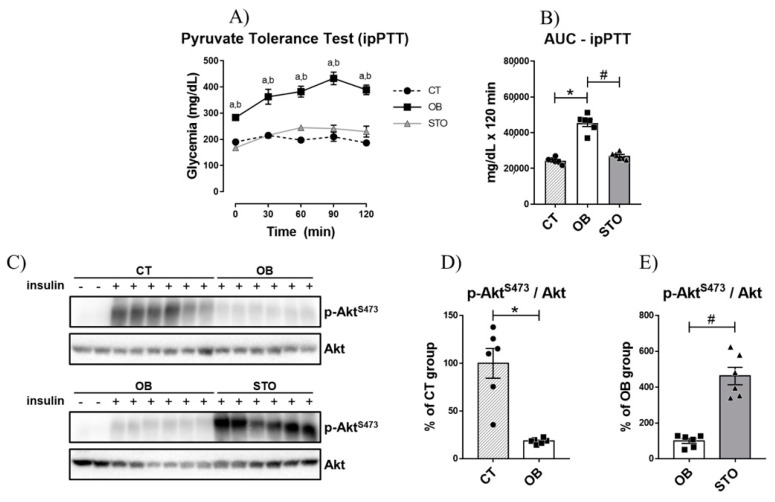
Figure 2.
Hepatic Glucose Production and Hepatic Insulin Signaling. Glycemic curve during Intraperitoneal Pyruvate Tolerance Test (ipPTT) (A); Area Under the Curve (AUC) during ipPTT (B), Bands of phospho-AktS473 and total Akt (C), Quantification of p-AktS473/Akt of CT and OB groups (D); Quantification of p-AktS473/Akt of OB and STO groups (E). n = 6 per group. CT = Control group; OB = Obese Sedentary Group and STO = Strength Training Obese. In (A): a = p < 0.05 for CT vs. OB; b = p < 0.05 for OB vs. STO. In (B,D,E): * p < 0.05 vs. CT; # p < 0.05 vs. OB. CT: n = 8 (2 saline injection + 6 insulin injection)—OB: n = 8 (2 saline injection + 6 insulin injection)—STO n = 6 (all insulin injection). The statistical analysis was performed with insulin injected mice.

