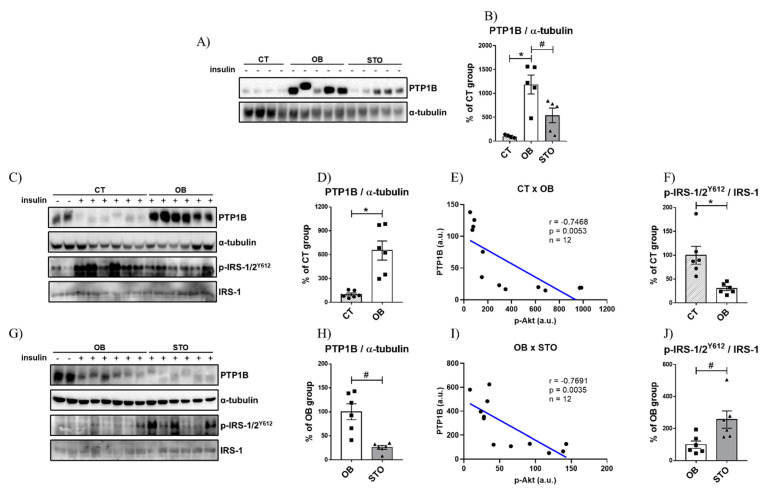
Figure 3.
PTP1B content is increased in obese mice and STO downregulates PTP1B content. Bands of basal PTP1B, β-actin p-IRS-1/2 (Y612) and total IRS-1 of CT, OB, and STO groups (A), Quantification of basal PTP1B normalized with α-tubulin of CT, OB, and STO groups (B), Bands of PTP1B and α-tubulin of CT and OB groups (C), Quantification of PTP1B normalized with α-tubulin of CT and OB groups (D), Correlation between the protein content of PTP1B and p-Akt of CT and OB groups (E), Quantification of p-IRS-1/2 (Y612) normalized with total IRS-1 of CT and OB groups (F), Bands of PTP1B and α-tubulin of OB and STO groups (G), Quantification of PTP1B normalized with α-tubulin of OB and STO groups (H), Correlation between the protein content of PTP1B and p-Akt of CT and OB groups (I), Quantification of p-IRS-1/2 (Y612) normalized with total IRS-1 of OB and STO groups (J). CT = Control group; OB = Obese Sedentary Group and STO = Strength Training Obese. * p < 0.05 vs. CT; # p < 0.05 vs. OB. Panels A–B: n = 4–6 animals per group—all saline-injected animals. Panels C–H: CT: n = 8 (2 saline injection + 6 insulin injection)—OB: n = 8 (2 saline injection + 6 insulin injection)—STO n = 6 (all insulin injection). The statistical analysis in panels C–H was performed with insulin-injected mice.

