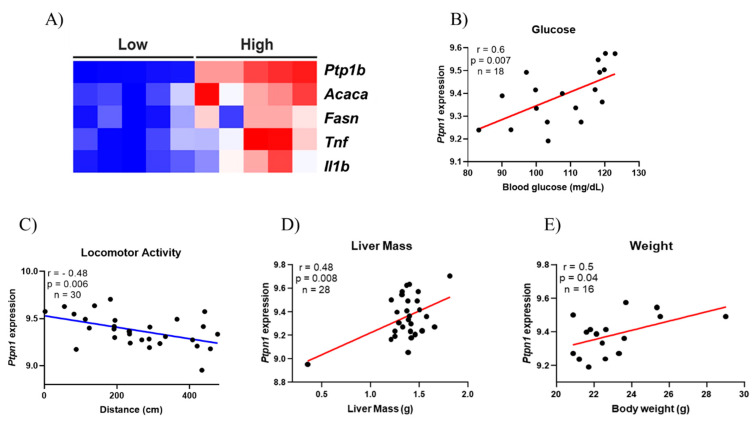
Figure 4.
Bioinformatics analysis. Heatmap illustrating the lower and higher expression of Protein-Tyrosine Phosphatase 1B (PTP1B) and the influence in lipogenic genes [Acetyl-CoA Carboxylase (ACC) and Fatty Acid Synthase (FAS)] and inflammatory genes [Tumor Necrosis Factor (TNF) and interleukin 1β (IL1β)] on human liver tissue. The figure illustrates clusters between the groups Low and High showing that they are directly related (A); Correlation between PTP1B gene expression and Blood Glucose levels (n = 18) (B); Correlation between PTP1B gene expression and locomotor activity (n = 30) (C); Correlation between PTP1B gene expression and liver mass (n = 28) (D); Correlation between PTP1B gene expression and body weight (n = 16) (E).

