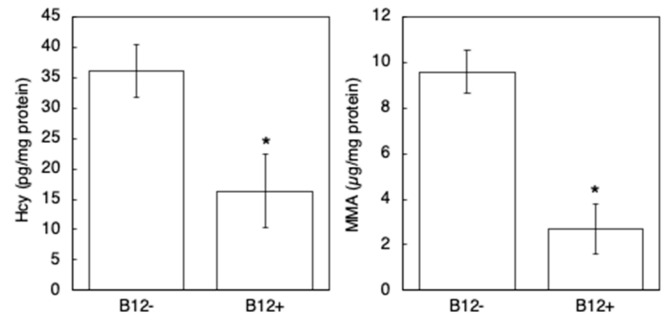
Figure 2.
Hcy and MMA levels in B12− and B12+ N2 worms. Hcy and MMA levels were measured as described in the Materials and Methods section. All values represent the mean ± SD of three independent experiments (n = 3). Asterisks indicate significant differences compared to the B12− worms (* p < 0.05).

