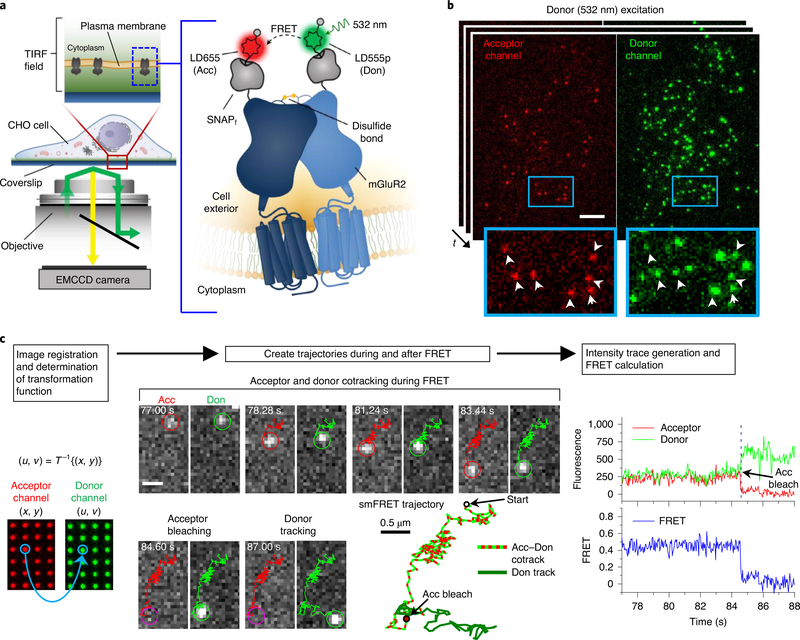
Fig. 1 |. Imaging and tracking receptor dimers in living mammalian cells by smFRET.
a, Schematic of single-molecule TIRF imaging of CHO cells expressing Sf-mGluR2 labeled with LD555p and LD655 fluorophores. Don, donor; Acc, acceptor; EMCCD, electron-multiplying charge-coupled device. b, Representative image of a movie (frame 3, 0.12 s) of labeled Sf-mGluR2 excited by the donor laser (532 nm), showing acceptor signals colocalized with their corresponding donors, both delineated by white arrows. Scale bar, 5 μm; enlarged view, 8.8 μm × 5.8 μm. c, Data analysis and tracking platform for smFRET. Left, a set of control points was used to derive a nonlinear transform function T. The spatial position of the donor signal was then calculated by mapping the acceptor position at each time point onto the donor channel. Middle, representative smFRET image sequence of Sf-mGluR2 diffusing at the cell surface, showing the acceptor during FRET and its corresponding donor in the left and right channels, respectively. Scale bars, 1 μm. Trajectories for the acceptor and donor are shown as red and green lines in the image sequence. Right, fluorescence intensity time traces were generated, and FRET was calculated for each smFRET trajectory. The time traces correspond to the image sequence and smFRET trajectory shown.

