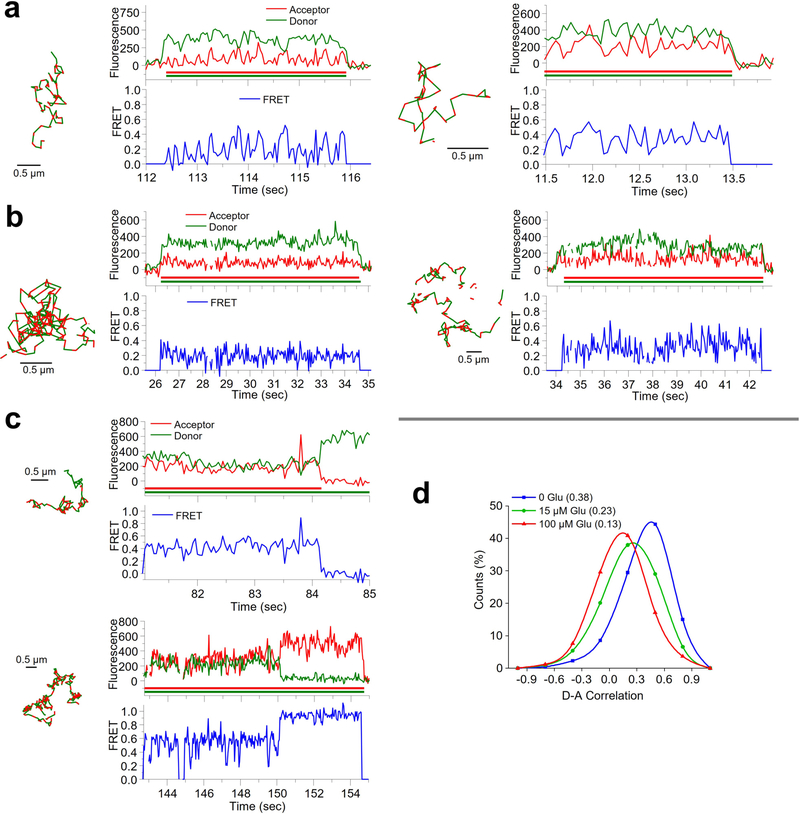
Extended Data Fig. 5 |. SmFRET data for Sf-mGluR2 dimers diffusing within the plasma membrane of living cells.
Representative smFRET trajectories and their corresponding fluorescence- and FRET-time traces for individual receptors in the presence of a, 15 μM and b, 100 μM glutamate (Glu) as well as c, those showing transitions to the 0.84 FRET state (top, apo condition; bottom, 15 μM Glu condition). d, Pearson correlation coefficients between donor and acceptor fluorescence traces were compiled into histograms for trajectories obtained in the absence of ligands (blue), or in the presence of 15 μM Glu (green) or 100 μM Glu (red). Lines are spline interpolations to facilitate comparison between conditions. Values in the legend correspond to the ensemble average correlation values.

