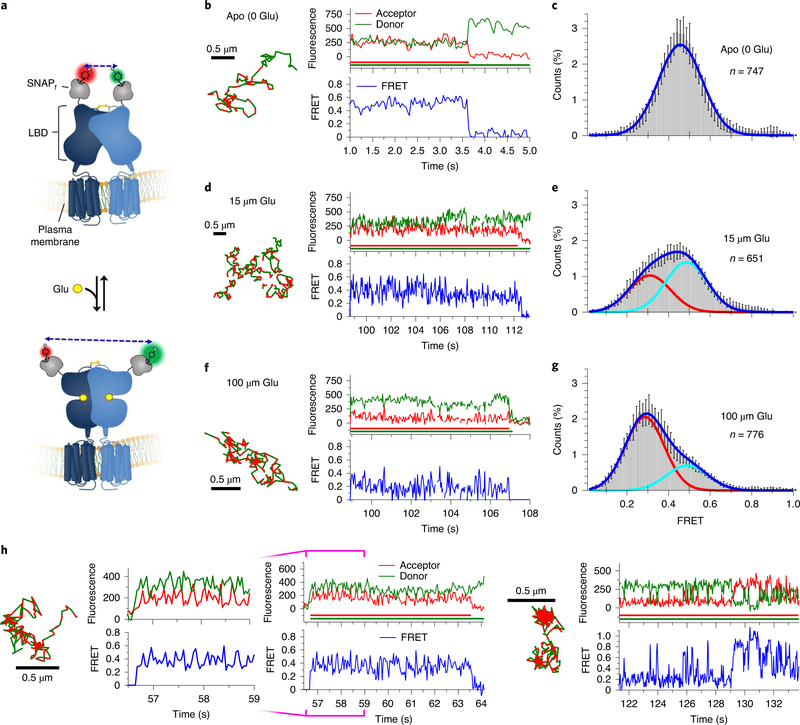
Fig. 2 |. Agonist-induced conformational dynamics in Sf-mGluR2 dimers.
a, Schematic depicting the structural reorganization of the LBD of mGluR2 upon glutamate (Glu) binding. Representative smFRET trajectories and their corresponding fluorescence and FRET time traces for receptor in the absence (apo) (b) or in the presence of 15 μM (d) or 100 μM (f) glutamate. The smFRET trajectories for each molecule are shown to the left of their fluorescence (donor and acceptor trajectories and intensities are shown in green and red, respectively) and FRET traces (in blue). The green and red bars along the time axis in the fluorescence time trace plots indicate that the signal was derived during tracking. FRET efficiency histograms of freely diffusing smFRET trajectories for molecules in the apo state (c) or in the presence of 15 μM (e) or 100 μM (g) glutamate. Histograms comprising the number of trajectories (n) shown from six cells for each condition were fit with a single Gaussian model for apo receptor, while those for glutamate-treated receptor were best fit with a two-state Gaussian model. Each bar height represents the mean count of FRET values calculated from six cell samples. The length of the error bars corresponds to 1 s.d. from the mean. h, Representative smFRET trajectories and their corresponding fluorescence and FRET time traces for receptors that show dynamics within the LBD. The trace to the left, at 100 μM glutamate, shows transitions between the ~0.29 and ~0.49 state. The trace on the right shows transitions between several states, including the ~0.84 state.

