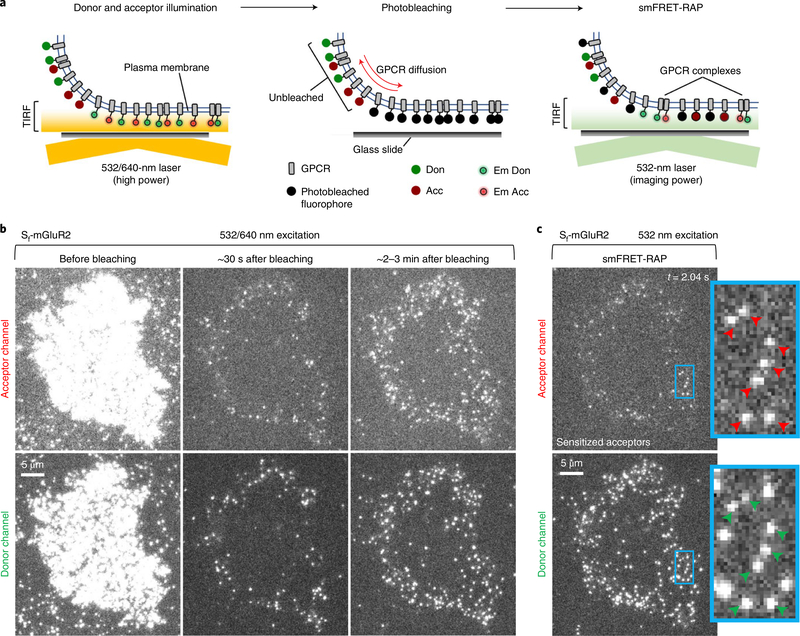
Fig. 4 |. Summary of the smFRET-RAP method and representative Sf-mGluR2 data.
a, Schematic of the smFRET-RAP approach. Active donor- and acceptor-labeled receptors in the TIRF-illumination field are selectively photobleached in TIRF mode, producing an analysis region within the plasma membrane defined by the TIRF field. Unbleached acceptor- and donor-labeled receptors subsequently diffuse from the apical membrane outside the TIRF field into the analysis region, so that single molecules can be resolved and imaged under normal single-molecule TIRF imaging conditions. Em Don, emitting donor; Em Acc, emitting acceptor. b, TIRF images taken briefly by direct and simultaneous donor and acceptor excitation of a representative CHO cell from eight cells expressing labeled Sf-mGluR2 before donor and acceptor photobleaching (left), ~30 s after photobleaching (middle) and ~2–3 min after photobleaching (right), showing the recovery of labeled receptors (scale bar, 5 μm). c, SmFRET-RAP image of the cell shown in b, taken by donor excitation, showing sensitized acceptors and associated donors, depicted by red and green arrows, respectively. Scale bar, 5 μm; inset, higher magnification (3.7 μm × 6.7 μm).

