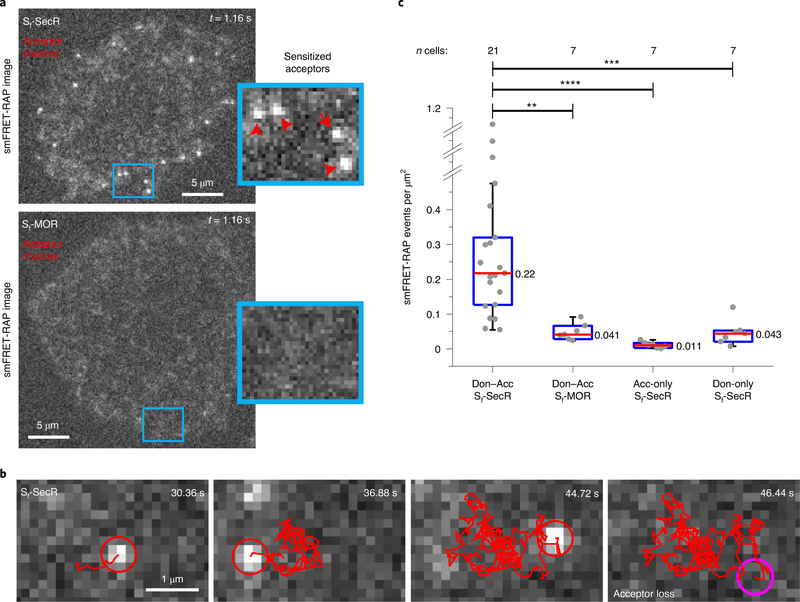
Fig. 5 |. Summary of smFRET-RAP data for Sf-SecR and Sf-MOR.
a, Representative smFRET-RAP image of acceptors during FRET (sensitized acceptors) for a CHO cell expressing donor- and acceptor-labeled Sf-SecR (top) from 21 cells or Sf-MOR (bottom) from 7 cells. Scale bar, 5 μm; insets, higher magnification (4.8 μm × 3.8 μm). b, Sensitized acceptor image sequence during FRET with a corresponding trajectory (red line) for Sf-SecR. c, Distribution of smFRET-RAP events per cell area for donor- and acceptor (Don–Acc)-labeled Sf-SecR and Sf-MOR, as well as for acceptor-only- and donor-only-labeled Sf-SecR. Dots represent the total number of smFRET-RAP trajectories determined by NLT analysis per area for an individual cell. Box plot details are described in the legend of Fig. 3a. Donor- and acceptor-labeled Sf-SecR showed a significant difference compared to all of the other samples shown (****P = 7.02 × 10⁻⁵, DF = 20.1, t-statistic = 4.98; ***P = 3.01 × 10⁻⁴, DF = 22.0, t-statistic = 4.29; **P = 3.16 × 10⁻⁴, DF = 20.9, t-statistic = 4.31). Unpaired two-sided t-tests were performed to obtain P values.

