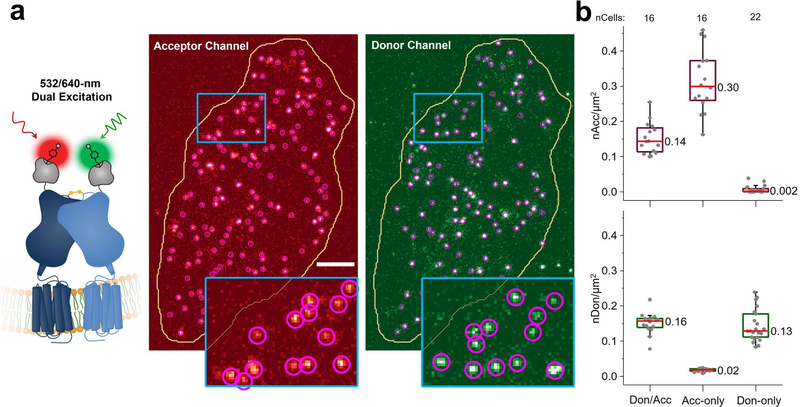
Extended Data Fig. 2 |. Quantification of the surface density of labeled Sf-mGluR2.
a, Representative initial image of a CHO cell containing donor and acceptor labeled Sf-mGluR2 of 16 cells generated by 532-nm and 640-nm dual excitation taken prior to smFRET imaging. Single-particle detection (purple circles) was used to quantify the number of particles within a region of interest (yellow line). Scale bar, 5 μm. b, Surface densities prior to smFRET imaging of cells labeled with donor and acceptor (Don/Acc) as well as with acceptor only (Acc-only) or with donor only (Don-only). Dots represent the number of acceptors or donors per area for each cell. Box plots indicate the median (central line) and interquartile range (IQR) (lower and upper box lines represent the 25- and 75-percentiles, respectively) while the whiskers represent those points that fall within 1.5 x IQR. The median density of total (acceptor + donor) labeled receptors was 0.30 receptors/μm2 (donor-to-acceptor ratio ~1:1). As expected, donor- and acceptor-only samples show labeling with only the fluorophore indicated.

