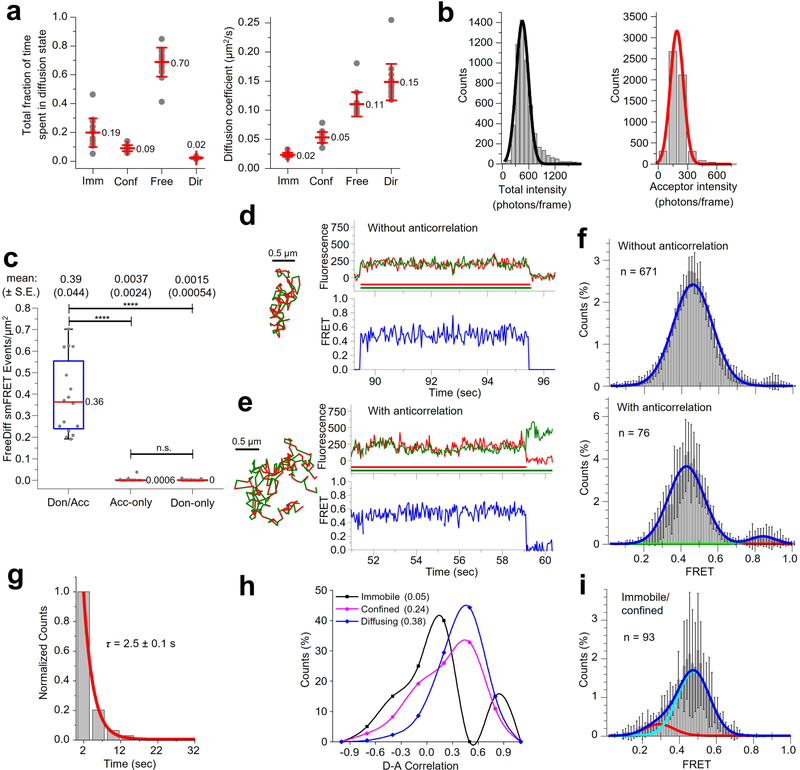
Extended Data Fig. 4 |. Characterizing fluorescence and smFRET data for Sf-mGluR2 in the plasma membrane of living cells.
a, Total fraction of time spent in (left) and diffusion coefficients (right) for immobile (imm), confined (conf), free, and directed (dir) diffusion states assigned by DC-MSS. Dots represent individual cell means and the middle and upper/lower lines depict the overall mean (values shown) and standard deviation, respectively, for 16 cells. b, Distributions of the total (donor + acceptor) and acceptor intensities during smFRET. Histograms comprised of 5,546 freely diffusing smFRET trajectories from 16 cells were fit with a single-state gaussian model, yielding mean total and acceptor intensities of 457 (FWHM of 284) and 190 (FWHM of 135) photons/frame, respectively. c, Distribution of freely diffusing smFRET events per cell for receptor labeled with donor and acceptor (Don/Acc) (16 cells) compared to those with acceptor-only (16 cells) and donor-only (22 cells). Dots represent the total number of freely diffusing smFRET trajectories (including freely diffusing segments from smFRET trajectories with more than one diffusion state) per area for each cell. Box plot details are described in the legend of Extended Data Fig. 2b. One-way ANOVA (DF = 53; F-value = 92.5) and Tukey post-hoc comparison were performed to obtain p-values (****p « 0.0001; not significant (n.s.) = 0.997). The sum of the mean number of events per cell for the controls represent ~1% of those from Don/Acc Sf-mGluR2. d, Representative smFRET trajectories and fluorescence- and FRET-time traces for Sf-mGluR2 in the absence of ligand (apo state) without and e, with anticorrelation. Here and elsewhere, smFRET trajectories are shown to the left of their fluorescence (red and green traces indicating the intensities are derived from acceptor and donor tracks) and FRET traces. f, FRET-efficiency histograms fit with a single-(top) or two (bottom)-state gaussian model from traces without (top) and with anticorrelation (bottom) containing donor and acceptor labeled-mGluR2. The histograms are comprised of the number of trajectories (n) indicated from 6 cells. Each bar height represents the mean count of FRET values calculated from 6 cell samples. The length of the error bars corresponds to 1 s.d. from the mean. g, Distribution of the duration of smFRET events of 4,800 freely diffusing smFRET trajectories from 16 cells with single-exponential decay constant τ. h, Pearson correlation coefficients between donor and acceptor fluorescence traces were calculated for each segment and are shown as a histogram for the immobile (black), confined (magenta), and freely diffusing (blue) motion types. Lines are spline interpolations to facilitate comparison between conditions. Values in the legend correspond to the ensemble average correlation values. (i) FRET efficiency histogram comprised of immobile/confined segments for Sf-mGluR2 labeled with donor and acceptor. The histogram is fit with a two-state Gaussian model and consists of 93 immobile/confined segments from trajectories that also showed free diffusion obtained from 6 different cells. Error bars are described in the legend of Extended Data Fig. 4f.

