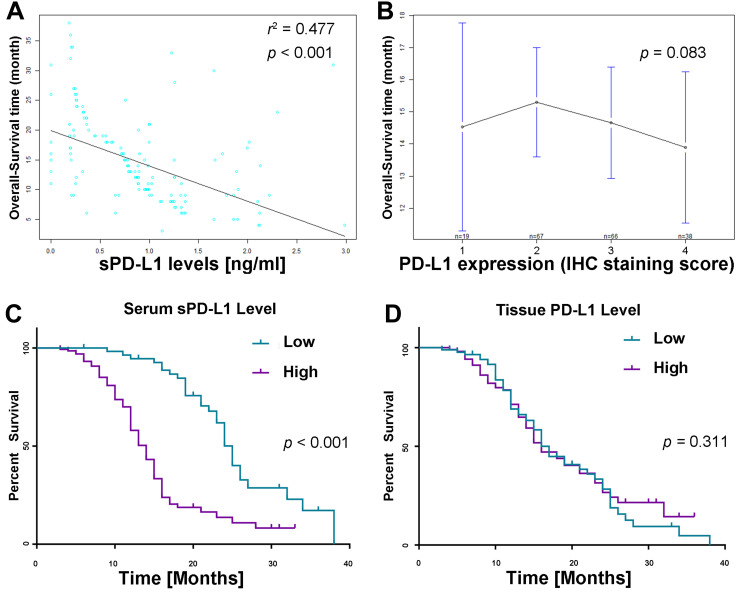
Figure 6.
Survival analysis according to sPD-L1 and PD-L1. (A) Correlation between sPD-L1 level and OS. Each dot represents one ESCC patient (r2=0.477, p<0.001). (B) Mean OS did not differ significantly between different tissue PD-L1 staining levels (p=0.083). (C) Subgroup analysis of OS according to serum sPD-L1 concentration (p<0.001). (D) Subgroup analysis of OS according to tissue PD-L1 expression level (p=0.311).

