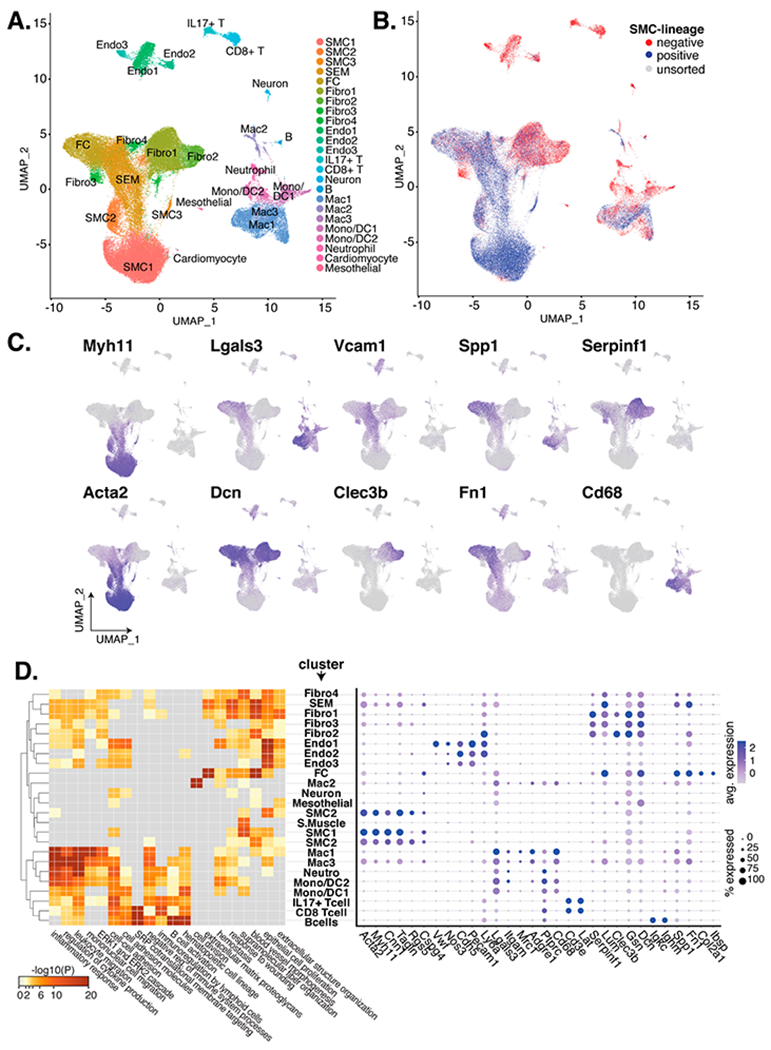
Figure 1. Meta-analysis of scRNA-seq on VSMC-lineage traced atherosclerotic lesions across 4 studies.

(A) UMAP of single cells from 33 scRNA-seq samples across 4 studies are colored by cluster. (B) Cells are colored as VSMC-lineage positive (blue), as VSMC-lineage negative (red), or as unsorted cells (grey). (C) Marker expression for relevant cell types and UMAP locales. (D) On the left, clusters (y-axis) are paired to the negative log10 p-value from pathway enrichment analysis (x-axis). On the right, markers for VSMC (Myh11-Cspg4), endothelial cell (Vwf-Ly6a), myeloid cells/macrophages (Lgals3-Cd68), T-cells (Cd3e and Lat), fibroblasts (Serpinf1-Dcn1), B-cells (Igkc and Ighm), and fibrochondrocytes (Spp1-Ibsp) are shown by percentage of cluster cells (dot radius) and average expression (dot color).
