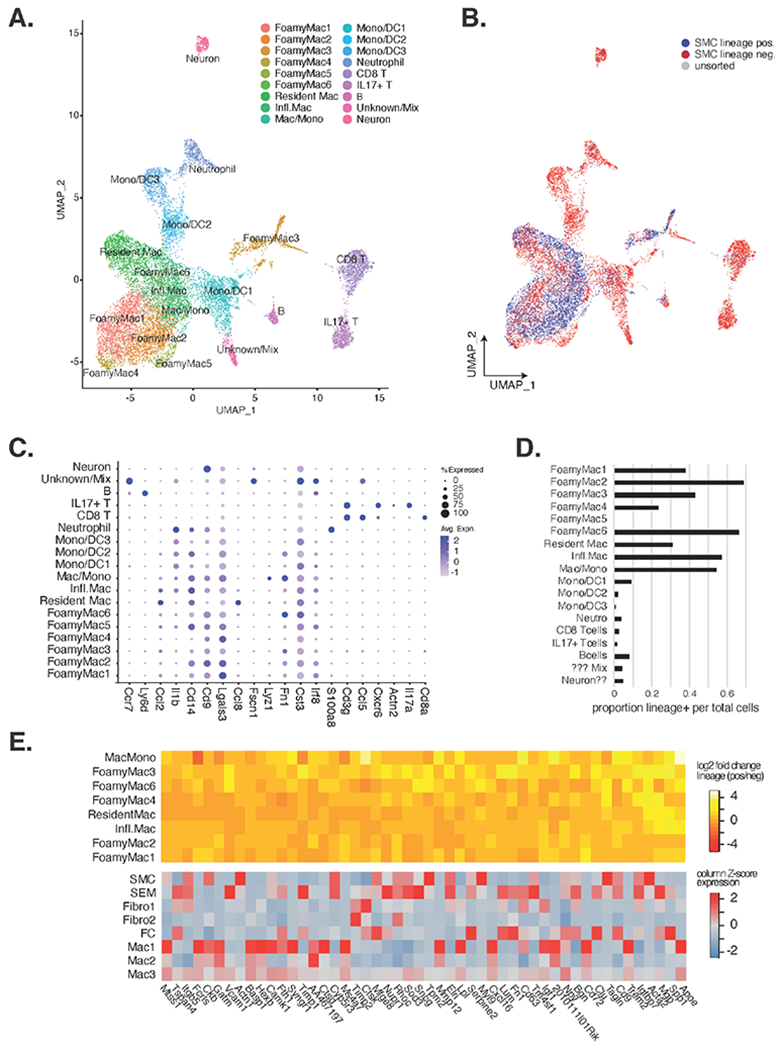
Figure 3. Further analysis of immune cells reveals 18 clusters with VSMC lineage positive cells most closely resembling macrophage subsets.

(A) UMAP reduction and clustering of only immune clusters from Figure 1 found 18 clusters that were annotated by leukocyte markers in Zernecke et al. (B) SMC lineage positive cells are shown in blue, lineage negative in red, and unsorted cells in grey. (C) Dotplot depiction of key immune cell marker genes. (D) Proportion of lineage positive cells (x-axis) by immune cell cluster (y-axis) are shown. (E) The top heatmap shows the log2 fold change of VSMC lineage positive over lineage negative expression of transcripts (x-axis) in the different immune cluster (y-axis) for the 50 most up-regulated genes in lineage positive cells. The bottom heatmap shows the relative expression of these same genes (x-axis) for mouse atherosclerotic lesions (unit = Z-scores for each transcript across clusters).
