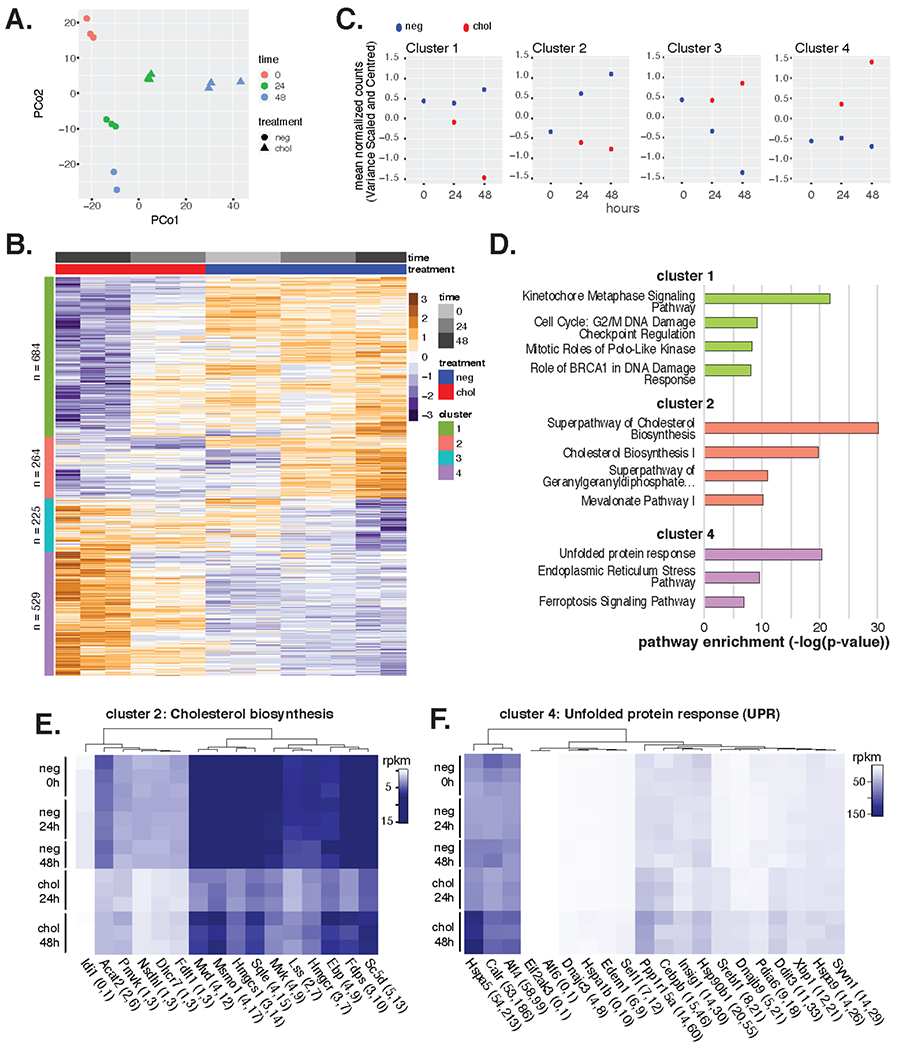
Figure 4. Primary cultured mVSMCs exhibit widespread transcriptional changes upon cholesterol loading.

(A) Principal Coordinates (PCo) Analysis of mVSMC RNA-seq samples ± cholesterol at 0 h, 24 h, and 48 h timepoints. (B) Transcript expression values per condition are shown by heatmap as normalized per row with cluster designation along left side bar. (C) Mean expression of transcripts per gene set over time. (D) Most enriched pathways are shown from Ingenuity Pathway Analysis. None were significant for cluster 3. (E) Cluster 2 Cholesterol Biosynthetic Pathway transcript expression across conditions. (F) Cluster 4 Unfolded Protein Response transcript expression across conditions.
