
Fig. 1. DA-D4 POCT schematic and analytical validation.
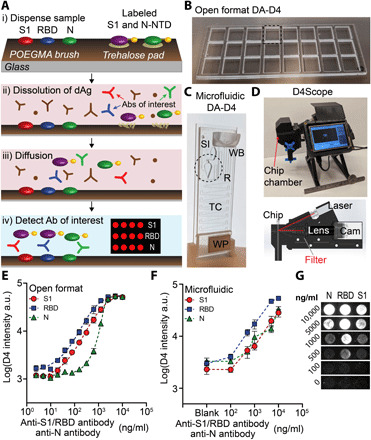
(A) DA-D4 assay chip schematic. S1, RBD, and N capture antigens and fluorescently labeled S1 and N-NTD detection antigens (dAgs) are inkjet-printed onto a POEGMA substrate. When a sample is added, dAgs are liberated from the surface owing to the dissolution of the underlying trehalose pad. Antibodies targeting each viral antigen then bridge the capture antigens to the dAgs, resulting in a fluorescence signal that scales with antibody concentration. (B) Open-format DA-D4 with 24 individual assays. (C) Microfluidic DA-D4. Sample is added to the sample inlet (SI), filling the reaction chamber (R) that contains the assay reagents. Wash buffer (WB) is added to the WB reservoir, which chases the sample through the microfluidic cassette. The timing channel (TC) sets the incubation time. All liquid is eventually soaked up by the wicking pad (WP) after the incubation process. The size is that of a standard microscope slide. (D) D4Scope and cut-away view of the optical path. The microfluidic flow cell is inserted on the left and pressing a button automates laser excitation, camera exposure, and data output. (E) Analytical validation of the open-format DA-D4. Antibodies targeting each antigen were spiked into undiluted human serum and incubated for 30 min. Each data point represents the average of three independent runs, and the error bars represent the SEM. a.u., arbitrary units. (F) Analytical validation of microfluidic DA-D4. Each data point for an antigen represents the average of four independent microfluidic flow cells and error bars represent the SEM. (G) Representative D4 spots shown for each dose. Photo credit for (B) to (D): David S. Kinnamon, Duke University.