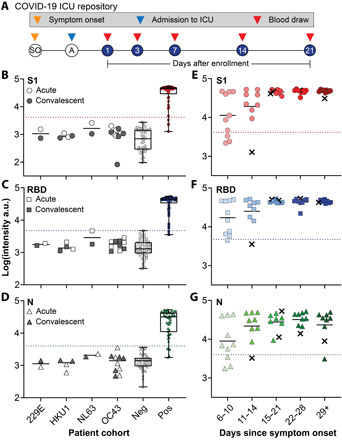
Fig. 2. Clinical validation study.

(A) Study design for COVID-19 ICU biorepository samples. Patients at Duke University Medical Center were enrolled into the study after admission to the ICU. Blood draws were taken at days 1, 3, 7, 14, and 21 after enrollment until discharge or death occurred. (B to D) Aggregated data for 46 positive samples, 41 negative controls, and 18 acute/convalescent coronavirus 229E (n = 2), HKU1 (n = 4), NL63 (n = 2), and OC43 (n = 10) samples tested for antibodies against (B) S1, (C) RBD, and (D) N. Dotted lines represent 2 SDs above the mean of the negative controls and the solid line represents the mean of each group. The box extends from the 25th to 75th percentiles and the line in the middle of the box is plotted at the median. The whiskers extend to the minimum and maximum values. (E to G) Data from (B) to (D) partitioned by days since symptom onset. For five samples, date since symptom onset was unknown, so days since first positive COVID-19 test were used (marked with an x).
