
Fig. 4. Longitudinal antibody tracking.
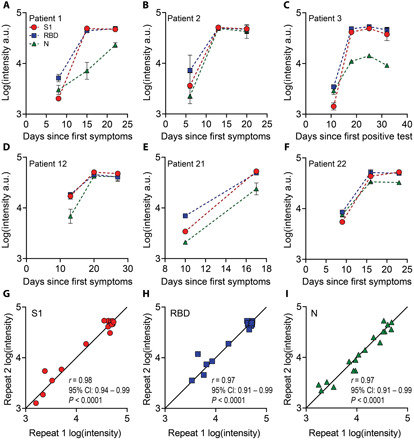
(A to F) Six patients were tracked across multiple time points for antibodies targeting S1, RBD, and N. For patient 3 (C), date since symptom onset was unknown, so days since first positive test was used. Each data point represents the average of two independent chips (with SD) run by separate users. (G to I) Data from parts (A) to (F) for each repeat. The solid line is drawn to have a slope of 1. There is a strong correlation between each repeat for (G) S1, (H) RBD, and (I) N, with a Pearson’s r of 0.98, 0.97, and 0.97, respectively (P < 0.0001).