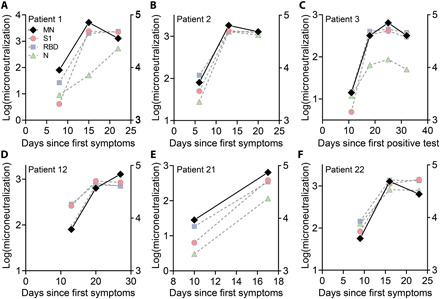
Fig. 5. Correlation to MN assay.

(A to F) MN assays were performed on each longitudinal sample (black diamonds) as described in Materials and Methods. The log-transformed MN titer is plotted on the left axis superimposed against the antibody data from Fig. 4 (plotted on the right axis).
