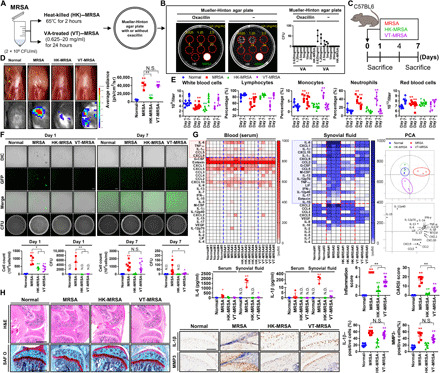
Fig. 3. MRSA directly exposed to a high dose of vancomycin allows for the recurrence of septic arthritis as evidenced by MRSA regrowth, inflammation, and cartilage damage.

(A) MRSA (2 × 10⁹ CFU/ml) was treated with different concentrations of vancomycin (0.625 to 20 mg/ml) for 24 hours, yielding VT-MRSA, or incubated at 65°C for 2 hours, yielding HK-MRSA. (B) VT-MRSA and HK-MRSA samples were seeded on plates containing either oxacillin or vehicle and incubated. MRSA was used as a positive control. The histogram presents the number of CFU from each group. (C) C57BL/6 mice were intra-articularly injected under the patella with DPBS (normal), MRSA (2 × 10⁷ CFU), HK-MRSA, and VT-MRSA (20 mg/ml) (n = 3 to 8 per group). (D) Gross images of knee joints with correlative heatmaps of MPO activity within the knee joint. (E) Blood was collected, and CBCs were measured. (F) Synovial fluid cell number was measured, and levels of GFP-positive MRSA were observed in synovium cells. MRSA bioburden was quantified in CFU. (G) The serum and synovial inflammatory profiles of septic joints were analyzed. The red and blue boxes highlight factors that underwent significant change in the setting of infection. The synovial inflammatory profiles of septic joints were analyzed by PCA. See fig. S6 for changes in individual cytokines, chemokines, and other factors. (H) Paraffin-embedded tissue sections were stained with H&E and SAF O, from which inflammation and OARSI scores were calculated (scale bar, 1000 μm). NLRP3, IL-1β, and MMP3 expression was detected, and the percentages of NLRP3-, IL-1β–, MMP3-positive cells were quantified (scale bar, 100 μm). One- or two-way ANOVA with Tukey’s post hoc analysis was used (*P < 0.05 or **P < 0.01). Photo credit: Photographer name: Hyuk-Kwon Kwon. Photographer institution: Yale University.
