
Fig. 2. Activation of CREB and gluconeogenic target genes in the livers of lung TB mice.
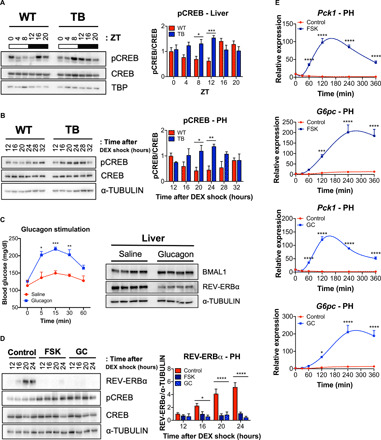
(A) Western blot analysis for phospho-CREB S133 (pCREB), total CREB, and TBP from liver nuclear fractions isolated from WT and TB mice at the indicated ZT. Histogram displays quantification of pCREB/total CREB over the circadian cycle (three independent experiments). (B) Western blot analysis for pCREB, total CREB, and α-TUBULIN in isolated PH at the indicated times (hours) after synchronization with DEX. Histogram displays quantification of pCREB/total CREB over the circadian cycle (three independent experiments). (C) Blood glucose levels (milligram per deciliter) measured at 0, 5, 15, 30, and 60 min after saline or GC (2 mg/kg body weight) administration via intraperitoneal injection at ZT7 in fasted WT mice. Western blot analysis for REV-ERBα, BMAL1, and α-TUBULIN in liver nuclear fractions at ZT9 (n = 4 independent mice per group). (D) Western blot analysis for REV-ERBα, pCREB, total CREB, and α-TUBULIN in WT PH treated with FSK (10 μM) or GC (0.1 μM) for 2 hours at the indicated times (hours) 12 hours after synchronization with DEX. Histograms show quantification of REV-ERBα/α-TUBULIN (three independent experiments). (E) Gene expression of Pck1 and G6pc in WT PH treated with FSK or GC at the indicated times (minutes) immediately after synchronization with DEX (three independent experiments). Data represent the means ± SEM with P value cutoff indicated as *P < 0.05, **P < 0.01, ***P < 0.001, and ****P < 0.0001 as determined by multiple t test or one-way analysis of variance (ANOVA) (with more than two groups).