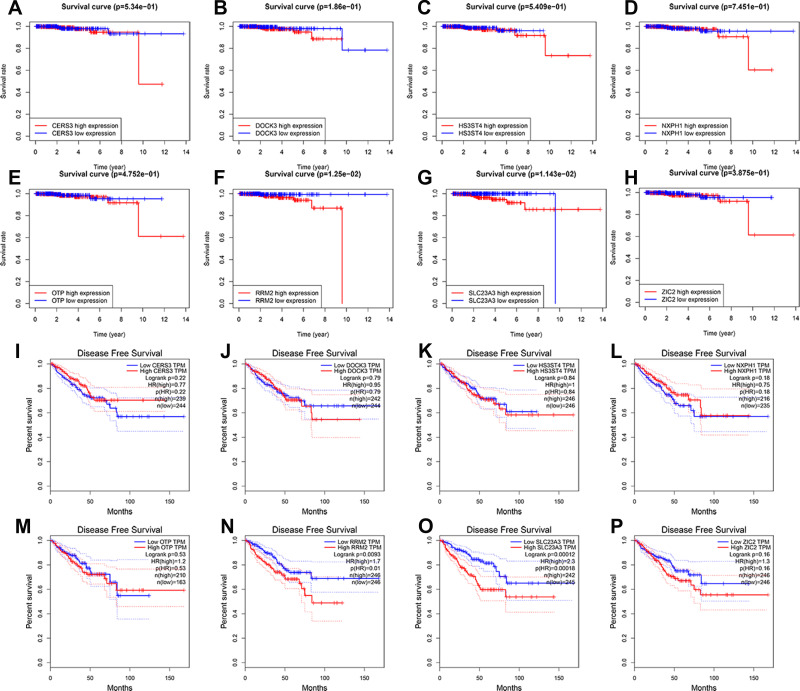
Figure 6.
Kaplan–Meier (K-M) survival analysis of the 8 target genes in prognostic signatures for patients with prostate cancer (PCa)in TCGA database and GEPIA database. The K-M survival curves showed there was no significant difference in overall survival (OS) in the high expression of CERS3 (A), DOCK3 (B), HS3ST4 (C), NXPH1 (D), OTP (E), ZIC2 (H) compared to its low expression in TCGA database. The K-M survival curves showed high expression of RRM2 (F) and SLC23A3 (G) had worse overall survival (OS) than its low expression in TCGA database (p<0.05). The K-M survival curves showed there was no significant difference in disease-free survival (DFS) in the high expression of CERS3 (I), DOCK3 (J), HS3ST4 (K), NXPH1 (L), OTP (M), ZIC2 (P) compared to its low expression in GEPIA database. The K-M survival curves showed high expression of RRM2 (N) and SLC23A3 (O) had worse DFS than its low expression in the GEPIA database (p<0.05).

