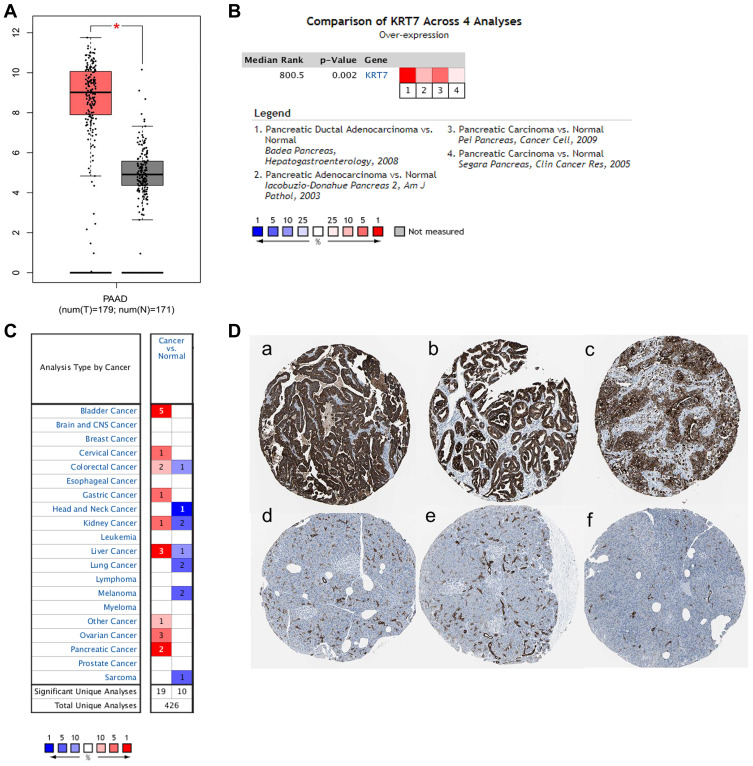
Figure 1.
The expression level of KRT7 in PAAD and normal pancreas tissues. (A) The expression of KRT7 in PAAD (red) and normal pancreas tissue (gray) analyzed by GEPIA. (B) Meta-analyses of the KRT7 expression in PAAD samples analyzed by Oncomine. (C) The expression of KRT7 in various tumors analyzed by Oncomine. Red indicates high expression, and blue indicates low expression. (D) Immunohistochemical staining of KRT7 in PAAD tissues (a-c) and normal pancreas tissues (d-f) analyzed by the HPA database.

