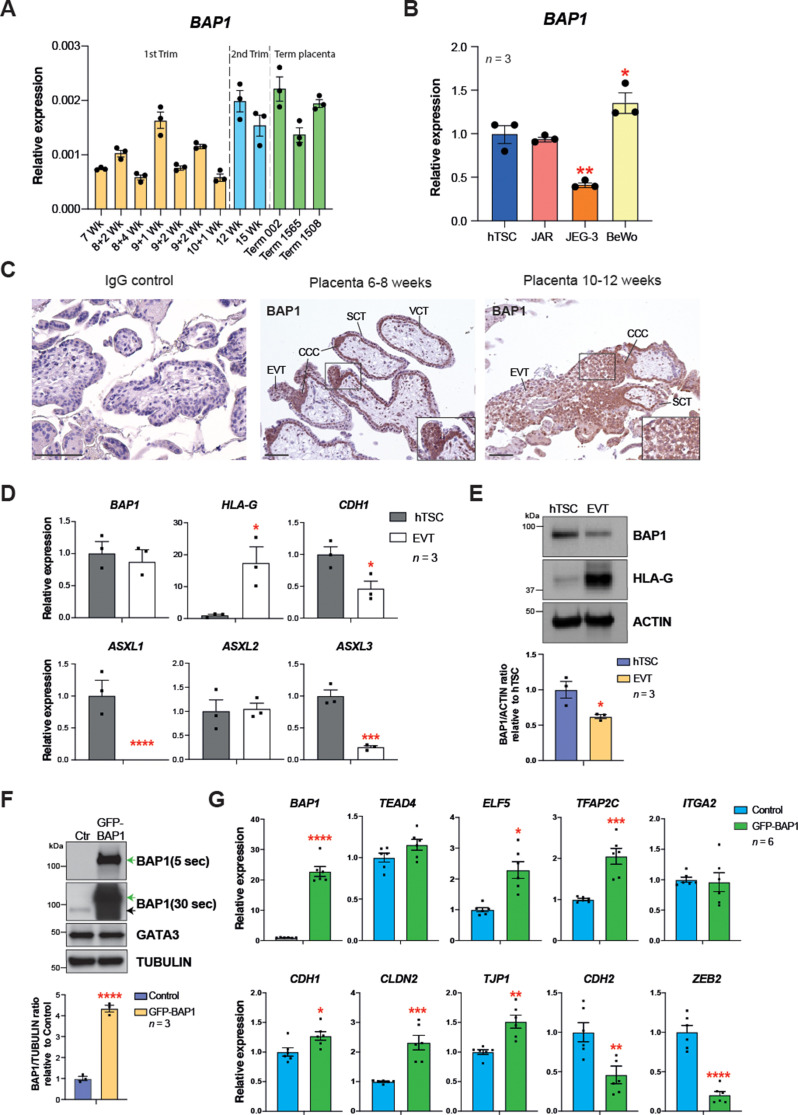
Figure 6. BRCA1-associated protein 1 (BAP1) polycomb repressive deubiquitinase (PR-DUB) modulation is also observed in human placentation.
(A) RT–qPCR analysis of BAP1 expression on human placental villous samples ranging from 7 weeks of gestation to term. Three independent term placental samples were investigated. An overall increase of BAP1 expression was observed over gestation. Expression is normalized to YWHAZ housekeeping gene. Data are mean of three replicates ± SEM. (B) RT-qPCR analysis of BAP1 expression in human trophoblast stem cells (hTSCs) and the choriocarcinoma cell lines JAR, JEG-3, and BeWo. Expression is normalized to GAPDH. Data are mean of three replicates ± SEM; *p<0.05, **p<0.01 (one-way ANOVA with Dunnett’s multiple comparisons test). (C) Immunohistochemistry for BAP1 on early (6–8 weeks [wk] of gestation) and late first trimester placentae (10–12 weeks of gestation). BAP1 staining is strong in proliferative villous cytotrophoblast (VCT) and cytotrophoblast cell columns (CCC) compared to syncytiotrophoblast (SCT). Notably, invasive extravillous trophoblast (EVT) shows a diffuse and weak staining as cells undergo EMT. Representative images of three biological replicates. Scale bar: 100 μm. (D) RT-qPCR analysis of BAP1, HLA-G, CDH1, and ASXL1-3 gene expression on hTSCs and in vitro-differentiated EVT cells after 8 days of differentiation. Expression is normalized to GAPDH. Data are mean of three independent replicates ± SEM; *p<0.05, ***p<0.001, ****p<0.0001 (Student’s t-test). (E) Western blot analysis of BAP1 protein levels in EVT compared to hTSCs. As in the mouse, BAP1 is strongly downregulated during trophoblast differentiation towards the invasive EVT lineage. Graph shows the quantification of three independent replicates. Data are mean ± SEM; *p<0.05 (Student’s t-test). (F) hTSCs transduced with GFP-empty control or GFP-BAP1 lentiviral particles were isolated by using fluorescence activated cell sorting (FACS), grown in stem cell conditions and examined by Western blotting. TUBULIN was used as loading control. Green arrows point to the exogenous GFP-BAP1 band after 5 and 30 seconds (sec) of film exposure. Black arrow points to endogenous BAP1. Graph shows the quantification of three independent replicates. Data are mean ± SEM; ****p<0.0001 (Student’s t-test). (G) RT-qPCR analysis of control and GFP-BAP1-transduced hTSCs grown in stem cell conditions. Expression is normalized to TBP housekeeping gene expression. Data are mean of six independent replicates ± SEM; *p<0.05, **p<0.01, ***p<0.001, ****p<0.0001 (Student’s t-test).


