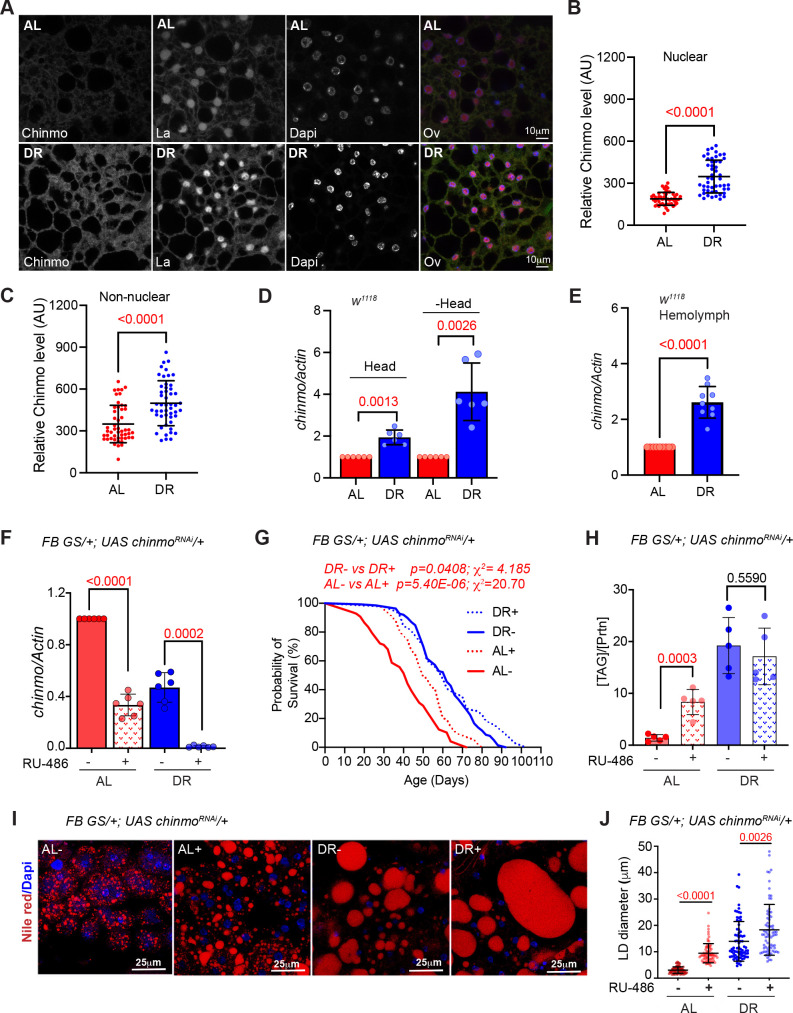
Figure 3. Chinmo is nutrient-dependent downstream effector of the DR-pathway.
(A) Chinmo protein levels increase in adult fat tissue of w1118 flies that were fed a DR diet for 10 days. Confocal images of dissected fat body from adult w1118 flies that were fed an AL or DR diet for 10 days. Immunostaining was performed with anti-Chinmo, anti-La (nuclear protein), and Dapi. Scale bar, 10 μm. (B, C) Quantitation of Chinmo protein levels in adult fat tissue nuclear and peripheral (non-nuclear) regions as determined by measuring pixel intensity in 10 cells in five samples per condition. Error bars represent mean ± SD and p values were calculated by unpaired t test with Welch’s correction. (D) DR induces expression of chinmo in w1118 flies. RT-PCR quantitation of chinmo mRNA in head and decapitated body tissue (-Head) of w1118 flies that were fed an AL or DR diet for 10 days. (E) DR increases circulating levels of chinmo mRNA in w1118 flies. RT-PCR quantitation of chinmo mRNA in the hemolymph of w1118 flies that were fed an AL or DR diet for 10 days. (F-J) Reducing chinmo levels in the adult fat body increases lifespan and enhances TAG levels under AL conditions. (F) A transgene expressing a short hairpin to knockdown chinmo was expressed in the adult fat body using the steroid (RU-486) inducible gene switch Gal4 driver. Quantitative RT-PCR of chinmo from abdominal fat tissue of FB GS >UAS chinmoRNAi flies in presence of RU-486 (bars with red and blue pattern) or in absence of RU-486 (bars with solid red and blue color) in flies that were fed Ad libitum (AL) (red) or DR diet (blue) for 10 days. Expression levels were normalized to Actin. Values are mean ± SD, n = 6. p Values are indicated in the graph and were calculated by unpaired t test with Welch’s correction. (G) Knockdown of chinmo in the adult fat tissue resulted in a 16% increase in the median lifespan of flies that were fed an AL diet (compare red solid line with the red dotted line) (Figure 3—source data 1A–B has details of experimental repeat). For statistical comparison of survival curves, p values and χ2 were calculated with log rank test. (H) Quantitation of triglyceride (TAG) stored levels in AL-RU-486 (Solid red bars), AL + RU-486 (Red pattern bars), DR-RU-486 (Solid blue bars) and DR +RU-486 (Blue pattern bars) fed 20-day-old FB GS >UAS chinmoRNAi flies. The bars represent mean ± SD, n = 5, p value was calculated with two tailed t-test. Significance levels: ***p<0.001. (I) Fat bodies of FB GS >UAS chinmoRNAi female flies were dissected and stained for the content and diameter of lipid droplet (LD) (red are lipid droplets stained with Nile red and blue is Dapi). Scale bar, 25 μm. (J) Quantitation of lipid droplet (LD) diameter in (I). Quantitation of 15 largest LDs in five samples per condition. Error bars represent mean ± SD and p values are indicated in the graph and were calculated by using unpaired t test with Welch’s correction. Genotypes of strains used in this figure: (A-E) w1118; (F-J) FB GS/+; UAS chinmoRNAi/+; w1118; P{w[+mW.hs]=Switch1}106/+; P{w+, UAS-chinmoRNAi 148}VK00033/+.


