. 2021 Jun 8;10:e62621. doi: 10.7554/eLife.62621

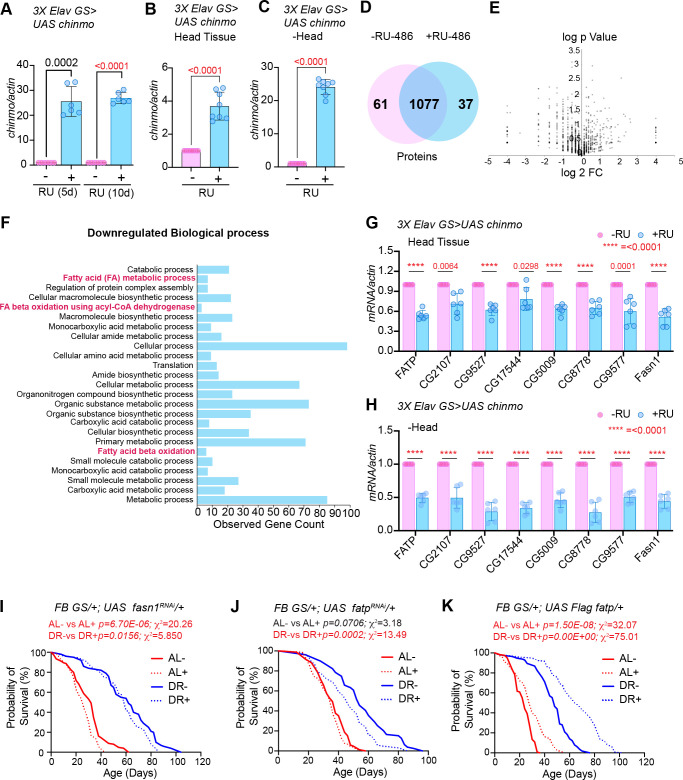
Figure 7. Ectopic expression of chinmo in adult neurons represses transcription of genes involved in fat metabolic processes.

(A) Quantitation of chinmo mRNA levels in RNA extracted from 3X ElavGS >UAS chinmo flies that were fed a solvent (light blue bars) or RU-486 (pink bars) diet for 5 and 10 days. (B, C) Quantitation of chinmo mRNA levels in RNA extracted from head tissue (B) and decapitated body tissue (C) of 3X ElavGS >UAS chinmo flies that were fed ethanol (blue bar) or RU-486 (pink bar) diet for 10 days. Expression levels were normalized to Actin5c. Values are mean ± SD, n = 3. (D) Venn diagram of 1175 proteins identified across the two groups (-RU-486 and +RU-486) and 91% were common between the two groups. (E) Volcano plot illustrating significantly differentially abundant proteins. Forty proteins were found to be differentially expressed by using a cutoff on p value ≤ 0.05 and log2FC ≥ 1 (7 upregulated) and ≤−1.0 (33 downregulated) proteins. (F) Twenty-five most significant biological processes that are downregulated upon overexpression of chinmo in adult neurons. See Figure 7—figure supplement 2 for upregulated biological processes. (G, H) Overexpression of chinmo in the adult nervous system downregulates genes involved in fat metabolism. RT-PCR quantitation of fold- change in mRNA levels of genes (F) involved in fat metabolism in the head tissue (G) and decapitated body tissue (H) of 3X ElavGS >UAS chinmo flies that were fed the solvent/ethanol (light blue bars) or RU-486 (pink bars) diet for 10 days. (I) Knockdown of fasn1 in the adult fat body reduces lifespan more significantly in flies that are fed an AL (compare red solid and dotted lines) compared to flies that are fed a DR diet (compare blue solid and blue dotted lines) conditions (See Figure 7—source data 1 for p values and median and maximum lifespan for additional experimental replicate). (J) Knockdown of fatp in the adult fat body reduces lifespan under DR (compare blue solid and blue dotted lines) conditions (See Figure 7—source data 2 for p values and median and maximum lifespan for additional experimental replicate). (K) Overexpression of Flag FATP increases lifespan in flies that are fed a DR diet (Compare blue dotted line with blue solid line) more significantly than flies that are fed an AL diet (See Figure 7—source data 3 for p values and median and maximum lifespan for additional experimental replicate). For statistical comparison of survival curves, p values and χ2 were calculated with log-rank test. Genotypes of strains used in this figure: (A-H) 3X ElavGS >UAS chinmo: P{elav-Switch.O}GS −1A / +; P{elav-Switch.O}GS-3A, P{elav-Switch.O} GSG301/P{w+, UAS-chin::SV40}/+; (I) FB GS/+; UAS fasn1RNAi/+: w1118; P{w[+mW.hs]=Switch1}106/+; P{y[+t7.7] v[+t1.8]=TRiP.HMS01524}attP2/+; (J) FB GS/+; UAS fatpRNAi/+:w[1118]; P{w[+mW.hs]=Switch1}106/+; P{y[+t7.7] v[+t1.8]=TRiP.HMC04206}attP2/+; (K) FB GS/+; UAS Flag fatp/+: w[1118]; P{w[+mW.hs]=Switch1}106/+;P{w+, UAS-Flag fatp} attP2/+.

Figure 7—source data 1. Lifespan analysis of FBGS >UAS fasn1RNAi and +/+; UAS fasn1RNAi strains.
Figure 7—source data 2. Lifespan analysis of FBGS >UAS fatpRNAi and +/+; UAS fatpRNAi strains.
Figure 7—source data 3. Lifespan analysis of FBGS >UAS Flag fatp and +/+; UAS Flag fatp strains.
Figure 7—source data 4. Survival proportions of lifespan curves of strains used in Figure 7I–K.
Figure 7—source data 5. Upregulated biological processes from proteomic analysis in Figure 7D–F.
Figure 7—source data 6. Downregulated biological processes from proteomic analysis in Figure 7D–F.

Figure 7.

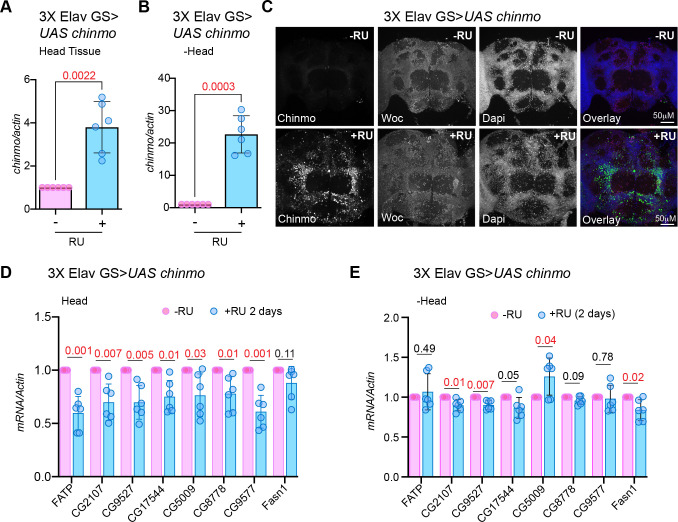
Figure 7—figure supplement 1. Overexpression of chinmo in adult neurons represses transcription of genes involved in fat metabolic processes in the brain within 2 days of induction.

Figure 7—figure supplement 1.

(A, B) Quantitation of chinmo mRNA levels in RNA extracted from head and decapitated body tissue of 3X ElavGS >UAS chinmo flies that were fed a solvent (light blue bars) or RU-486 (pink bars) diet for 2 days. (C) Female flies that were fed an RU-486 supplemented diet for 2 days displayed increased levels of Chinmo in neuronal cells, as detected by Chinmo, Woc (nuclear marker), and Dapi staining of dissected adult fly brains. (D, E) Overexpression of chinmo in the adult nervous system downregulates genes involved in fat metabolism. RT-PCR Quantitation of fold change in mRNA levels of genes involved in fat metabolism in the head tissue (D) and decapitated body tissue (E) of 3X ElavGS >UAS chinmo flies that were fed a solvent (light blue bars) or RU-486 (pink bars) diet for 2 days. (D) Induction of Chinmo for 2 days was sufficient to lead a statistically significant reduction of seven of the eight genes analyzed in the head tissue. (E) 3 out of 8 genes analyzed also displayed a statistically significant albeit lower reduction in the decapitated body tissue. Expression levels were normalized to Actin5c. Values are mean ± SD, n ≥ 3. p Values were calculated by using unpaired t test with Welch’s correction. Genotypes of strains used in this figure: (A-E) 3XElavGS > UAS chinmo: P{elav-Switch.O}GS −1A / +; P{elav-Switch.O}GS-3A, P{elav-Switch.O} GSG301/P {w+, UAS-chin::SV40}/+.
Figure 7—figure supplement 2. Over expression of chinmo in adult neurons upregulates cytoplasmic processes.
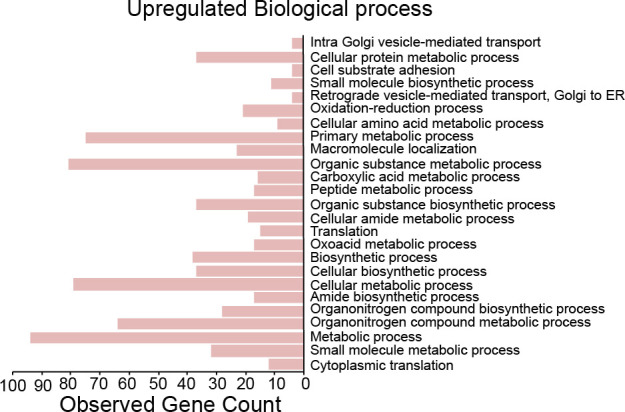
Figure 7—figure supplement 2.

Twenty-five most significant biological processes that are upregulated upon overexpression of chinmo in adult neurons.
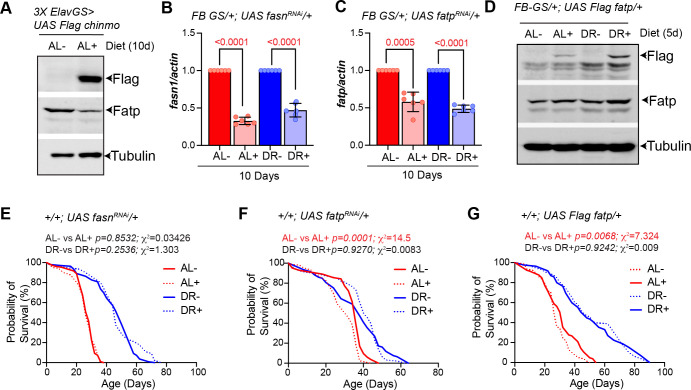
Figure 7—figure supplement 3. Molecular and survival analysis of strains utilized in Figure 7.

Figure 7—figure supplement 3.

(A) Overexpression of flag Chinmo in the adult brain neurons leads to a reduction in Fatp protein. Western blot analysis of adult fly lysates from 3X ElavGS >UAS Flag chinmo flies that were fed an AL diet in presence (+AL) or absence (AL-) of RU-486. The whole fly cell lysates were analyzed by western blotting with Flag (Flag Chinmo), Fatp and Tubulin (normalization control) antibodies. Fatp levels reduced upon overexpression of Flag chinmo. (B) Quantitative RT-PCR of fasn1 from abdominal tissue of FB GS >UAS fasn1RNAi flies in presence of RU-486 (light red and light blue) or in absence of RU-486 (bars with solid red and blue color) flies that were fed Ad libitum (AL) (red) or DR diet (blue) for 10 days. Expression levels were normalized to Actin. Values are mean ± SD, n = 6. (C) Quantitative RT-PCR of fatp from abdominal tissue of FB GS >UAS fatpRNAi flies in presence of RU-486 (light red and light blue) or in absence of RU-486 (bars with solid red and blue color) flies that were fed Ad libitum (AL) (red) or DR diet (blue) for 10 days. Expression levels were normalized to Actin. Values are mean ± SD, n = 6. Fatp is more significantly knocked down under DR conditions. (D) Western blot of whole fly lysates from FB GS/+; UAS Flag fatp/+flies that were fed an AL and DR diet in presence (AL+, DR+) and absence (-AL, -DR) of RU-486. The whole fly cell lysates were analyzed by western blotting with Flag (Flag Fatp), Fatp, and Tubulin (normalization control) antibodies. Flag Fatp was detected in AL + and DR +lysates. (E-G) Effect of RU-486 on the lifespan of UAS fasnRNAi, UAS fatpRNAi, and UAS Flag fatp flies. (E) Crosses were established between UAS fasnRNAi and w1118 and the progeny was sorted into four groups (AL-, DR-, AL +, and DR+). Median lifespan in: AL- is 28 days; AL + is 26 days: DR- is 50 days and DR +is 46 days. (F) Crosses were established between UAS fatpRNAi and w1118 and the progeny was sorted into four groups (AL-, DR-, AL +, and DR+). Median lifespan in: AL- is 36 days; AL + is 32 days: DR- is 38 days and DR +is 42 days. (G) Crosses were established between UAS Flag fatp and w1118 and the progeny was sorted into four groups (AL-, DR-, AL + and DR+). Median lifespan in: AL- is 26 days; AL + is 32 days: DR- is 46 days and DR +is 48 days. For statistical comparison of survival curves, p values and Χ2 were calculated with log-rank test. Genotypes of strains used in this figure: (A) 3X ElavGS >UAS Flag chinmo: P{elav-Switch.O}GS −1A / +; P{elav-Switch.O}GS-3A, P{elav-Switch.O} GSG301/P{w+, UAS-chin::SV40}/+; (B) FBGS /+;UASfasnRNAi/+: w1118; P{w [+mW.hs]=Switch1}106/+;P{y[+t7.7]v[+t1.8]=TRiP.HMS01524}attP2/+;(CFBGS/+;UASfatpRNAi/+:w[1118];P{w[+mW.hs]=Switch1}106/+;P{y[+t7.7]v[+t1.8]=TRiP.HMC04206}attP2/+; (D) FBGS/+; UAS Flag fatp/+; w[1118]; P{w [+mW.hs]=Switch1}106/+;P{w+,UAS-Flag fatp}attP2/+; (E) UASfasn1RNAi/+: w1118; +/+; P {y[+t7.7]v [+t1.8]=TRiP. HMS01524} attP2/+; (FUAS fatpRNAi/+:w1118;+/+;P{y[+t7.7]v[+t1.8]=TRiP. HMC04206} attP2/+; (G) UAS Flag fatp/+: w1118;+/+; P{w+, UAS-Flag fatp} attP2 / +.
Figure 7—figure supplement 3—source data 1. Uncropped western blots with relevant bands labeled for Figure 7—figure supplement 3A and D.
Figure 7—figure supplement 3—source data 2. Original image files of the unedited for western blots in Figure 7—figure supplement 3A.
Figure 7—figure supplement 3—source data 3. Original image files of the unedited for western blots in Figure 7—figure supplement 3D.
Figure 7—figure supplement 3—source data 4. Survival proportions of lifespan curves of strains used in Figure 7—figure supplement 3E–G.