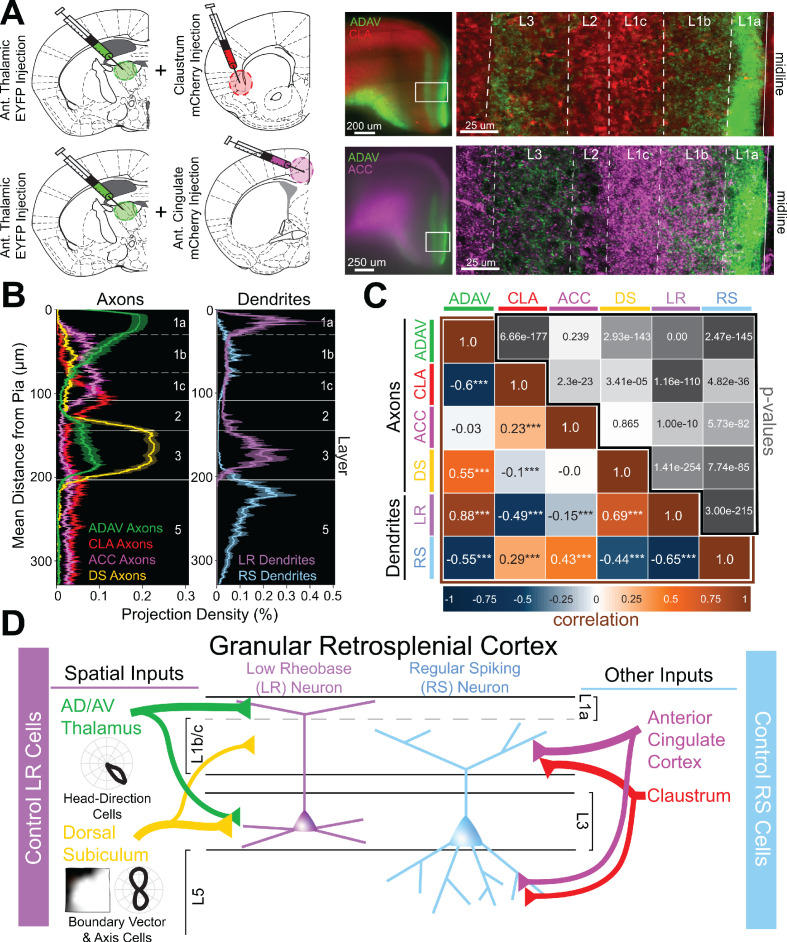
Figure 6. Two parallel circuits in superficial granular retrosplenial cortex.
(A) Left: Schematics of dual injections into anterior thalamus (ADAV) and claustrum (CLA; top) or anterior cingulate (ACC; bottom). Right: Resulting dual expression of ADAV (green) and CLA (red; top) or ACC (magenta; bottom) axons with zoomed-in confocal view of layers, demarcated by white lines. (B) Left: Projection density of anterior thalamus (ADAV; green; n = 5), claustrum (CLA; red; n = 6), anterior cingulate (ACC: magenta; n = 4), and dorsal subiculum (DS; yellow; n = 4; mean ± SEM shaded for all) axons and terminal arbors in RSG. Note distinct sublaminar distribution of axons from ADAV, ACC, and CLA in layer 1. Right: Projection density of LR (purple; n = 10) and RS (blue; n = 5; mean ± SEM shaded for all) neurons. Note the distinct difference between LR and RS dendrite lamination across the layers. (C) Correlation matrix of means for all axon-axon, axon-dendrite, and dendrite-dendrite comparisons. Note that LR dendrites are significantly positively correlated with ADAV and DS axons but negatively correlated with CLA and ACC axons, while RS dendrites are significantly positively correlated with CLA and ACC axons but negatively correlated with ADAV and DS axons. (D) Summary schematic showing selective control of LR neurons by inputs from ADAV and DS, including head direction signals. In contrast, RS neurons are preferentially controlled by inputs from the CLA and ACC. This precise organization of principal cell dendrites and afferent axons forms two parallel circuits in superficial RSG.


