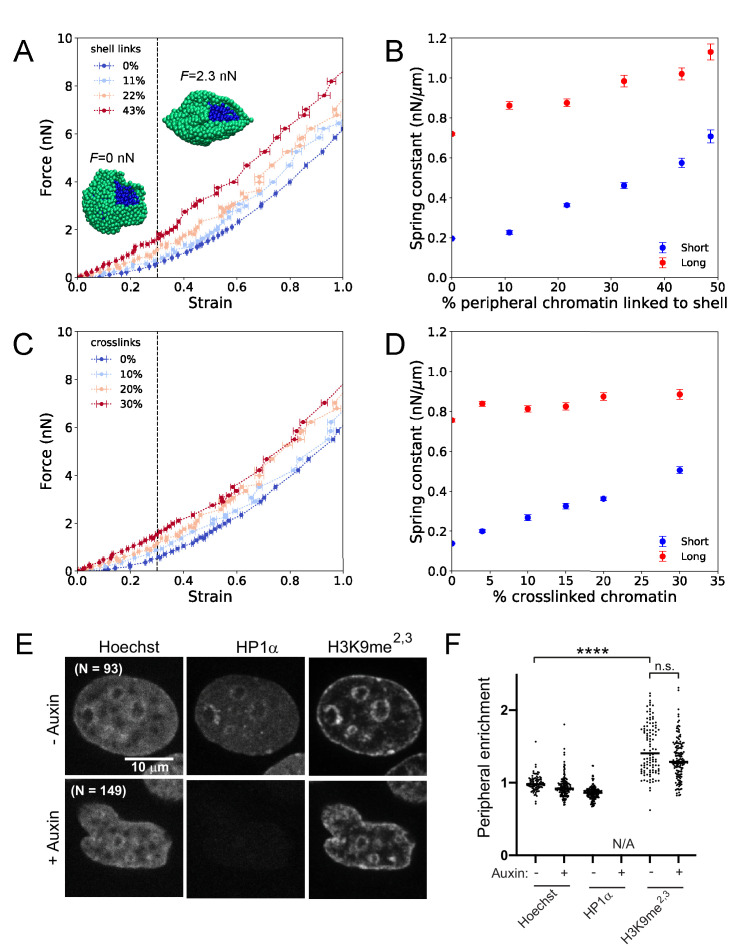
Figure 4. Simulations of nuclear mechanical response and experimental measurements of peripheral heterochromatin support a model with HP1α as a chromatin-chromatin crosslinker.
(A) Force-strain relationship for simulated nuclei with various levels of chromatin-lamina (shell) linkages. Colors indicate different percentages of chromatin segments linked to the lamina. Insets: Snapshots of simulations with a portion of the lamina (green) removed to reveal the interior chromatin (blue) for two different applied stretching forces, F. (B) Spring constants for short- and long-extension regimes for simulations with various levels of chromatin-lamina crosslinks, quantified by percentage of peripheral chromatin subunits linked to the shell (blue and red, respectively). (C) Force-strain relation for simulated nuclei with various levels of chromatin-chromatin crosslinks. (D) Spring constants for short- and long-extension with varying levels of chromatin-chromatin crosslinks (blue and red). Vertical dashed lines in (A) and (C) separate the short-extension and long-extension regimes. Each force-strain data point in (A) and (C) is an average that is computed from n ≥ 11 simulations. Short-extension spring constants in (B) and (D) are each computed from nshort ≥13 and 10 force-extension data points, respectively. Long-extension spring constants in (B) and (D) are each computed from nlong ≥19 and 15 force-extension data points, respectively. (E) Example images of HP1α-AID-sfGFP nuclei untreated or auxin-treated, analyzed for (F) enrichment measurements (peripheral/internal average signal) to determine peripheral enrichment of DNA (Hoechst), HP1α, and H3K9me2,3. p values denoted as n.s. >0.05 and ****<0.0001, calculated by one-way ANOVA. Error bars in (A)-(D) show standard error of the mean.

