. 2021 Jun 8;10:e63355. doi: 10.7554/eLife.63355

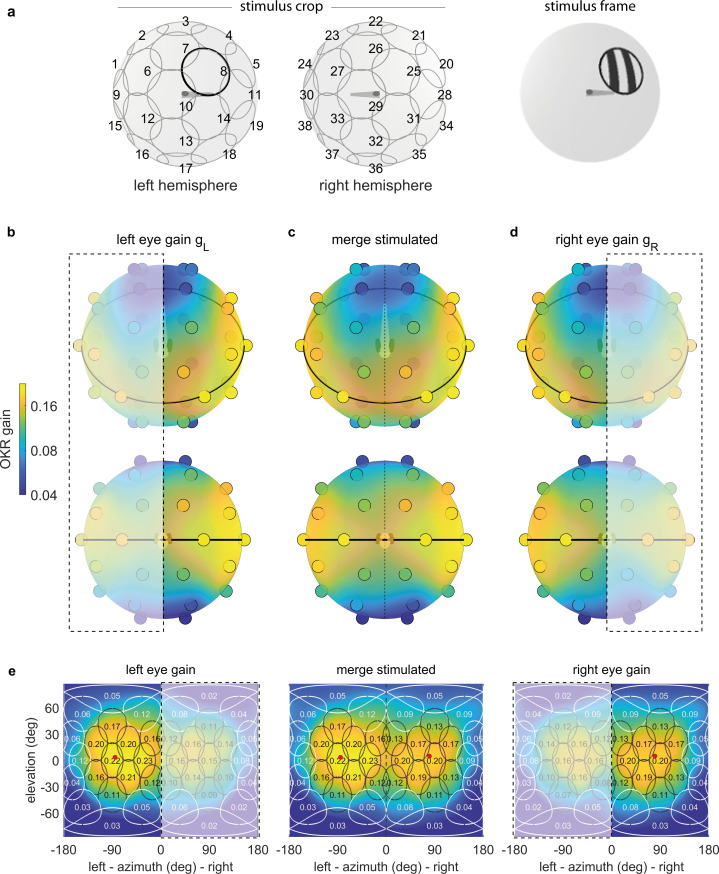
Figure 3. OKR gain depends on stimulus location.

(a) The stimulus is cropped to a disk-shaped area 40 degrees in diameter, centred on one of 38 nearly equidistant locations (Supplementary file 1B) across the entire visual field (left), to yield 38 individual stimuli (right). (b–d) Dots reveal the location of stimulus centres D1-D38. Their colour indicates the average OKR gain across individuals and trials, corrected for external asymmetries. Surface colour of the sphere displays the discretely sampled OKR data filtered with a von Mises-Fisher kernel, in a logarithmic colour scale. Top row: OKR gain of the left eye (b), right eye (d), and the merged data including only direct stimulation of either eye (c), shown from an oblique, rostrodorsal angle. Bottom row: same, but shown directly from the front. OKR gain is significantly higher for lateral stimulus locations and lower across the rest of the visual field. The spatial distribution of OKR gains is well explained by the bimodal sum of two von-Mises Fisher distributions. (e) Mercator projections of OKR gain data shown in panels (b–d). White and grey outlines indicate the area covered by each stimulus type. Numbers indicate average gain values for stimuli centred on this location. Red dots show mean eye position during stimulation. Dashed outline and white shading on panels (b, d, e) indicate indirect stimulation via yoking, that is, stimuli not directly visible to either the left or right eye. Data from n = 7 fish for the original configuration and n = 5 fish for the rotated arena.

Figure 3—source data 1. Numerical data and graphical elements of Figure 3b–d.
Figure 3—source data 2. Numerical data and graphical elements of Figure 3e.

Figure 3.

Figure 3—figure supplement 1. Gaps in the arena do not bias OKR behaviour.

Figure 3—figure supplement 1.

(a) Artificial triangular holes setup. (b) Artificial keel setup. (c) Neither triangular nor elongated gaps result in significantly different OKR gains (n = 5 fish).
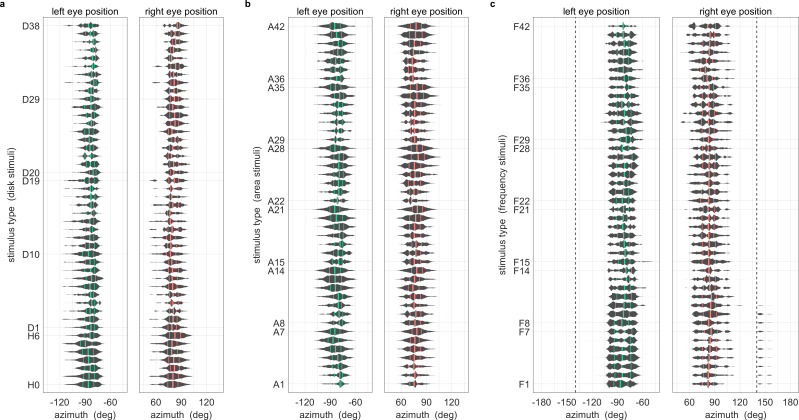
Figure 3—figure supplement 2. During OKR, the beating field and average eye position are independent of stimulus location.

Figure 3—figure supplement 2.

All data were pooled across fish and trials. One gain value was computed per stimulus presentation. Violin plots show distribution of mean horizontal eye positions across the pooled data; vertical lines indicate 25th percentile, median and 75th percentile of the distribution. Positions are those during presentation of stimulus types (a) D1 to D38 shown in Figure 3a, (b) A1 to A42 shown in Figure 5b, (c) F1 to F42 shown in Figure 5a. Dashed lines in (c) represent axis limits of (a,b).
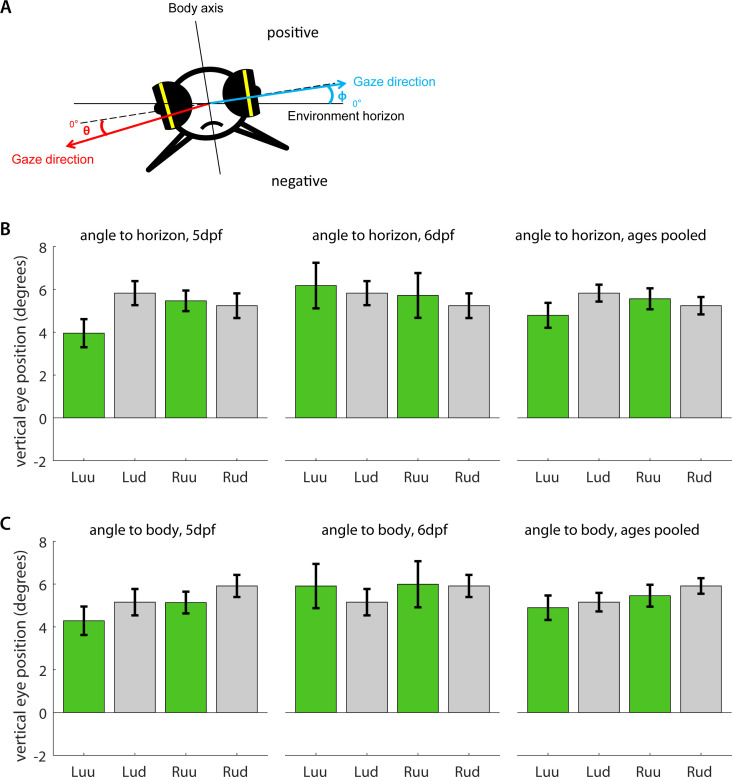
Figure 3—figure supplement 3. Vertical eye position under upright and upside-down embedding.

Figure 3—figure supplement 3.

(a) Five dpf and six dpf larvae were embedded in agarose with their eyes cut free and placed under a microscope. Using an additional mirror, we recorded simultaneous image time series along both the dorsoventral and mediolateral axes. Vertical eye position was determined geometrically for each individual frame (see Materials and methods). Because some larvae were embedded in such a way that mediolateral axis was not entirely aligned with the true horizon of the environment, we measured vertical eye position (b) relative to both the true environmental horizon, and (c) the mediolateral body axis, and in both cases, compared the left (L) and right eyes (R) of larvae embedded upside-up (uu) or upside-down (ud). To facilitate comparison, positive signs were chosen to roughly correspond to the dorsal hemisphere in both cases. Bars indicate mean after pooling across all frames, error bars show corresponding standard error of the mean (s.e.m.). In summary, larval eyes were almost always inclined towards the dorsum, irrespective of the direction of embedding. The fish do not appear to compensate for their orientation with respect to the gravitational axis.
Figure 3—figure supplement 4. Yoking indices are biased by reflections within the arena.

Figure 3—figure supplement 4.

Yoking indices were computed for experiments using the regular setup as in Figure 4a (light grey), with a rotated arena as in Figure 4b (dark grey), corrected for experimental asymmetries as in Figure 3 (green), and with one side of the glass bulb, contralateral to the stimulus centre, painted black (black). Yoking indices from most experiments are close to zero, indicating similar OKR gains for both eyes regardless of stimulus location. In contrast, yoking indices from the latter control experiment differ markedly from zero, indicating significantly weaker responses by the respectively unstimulated eye. This finding points to reflections at the air-glass interface being visible to the purportedly ‘unstimulated’ eye. Stimulus types are listed in the order given in Supplementary file 1B and Supplementary file 1E: the whole-field stimulus H1, hemifield stimuli H2 to H7, and then disk-shaped stimuli D1 to D38 from front to rear, top to bottom, and left hemisphere to right hemisphere.
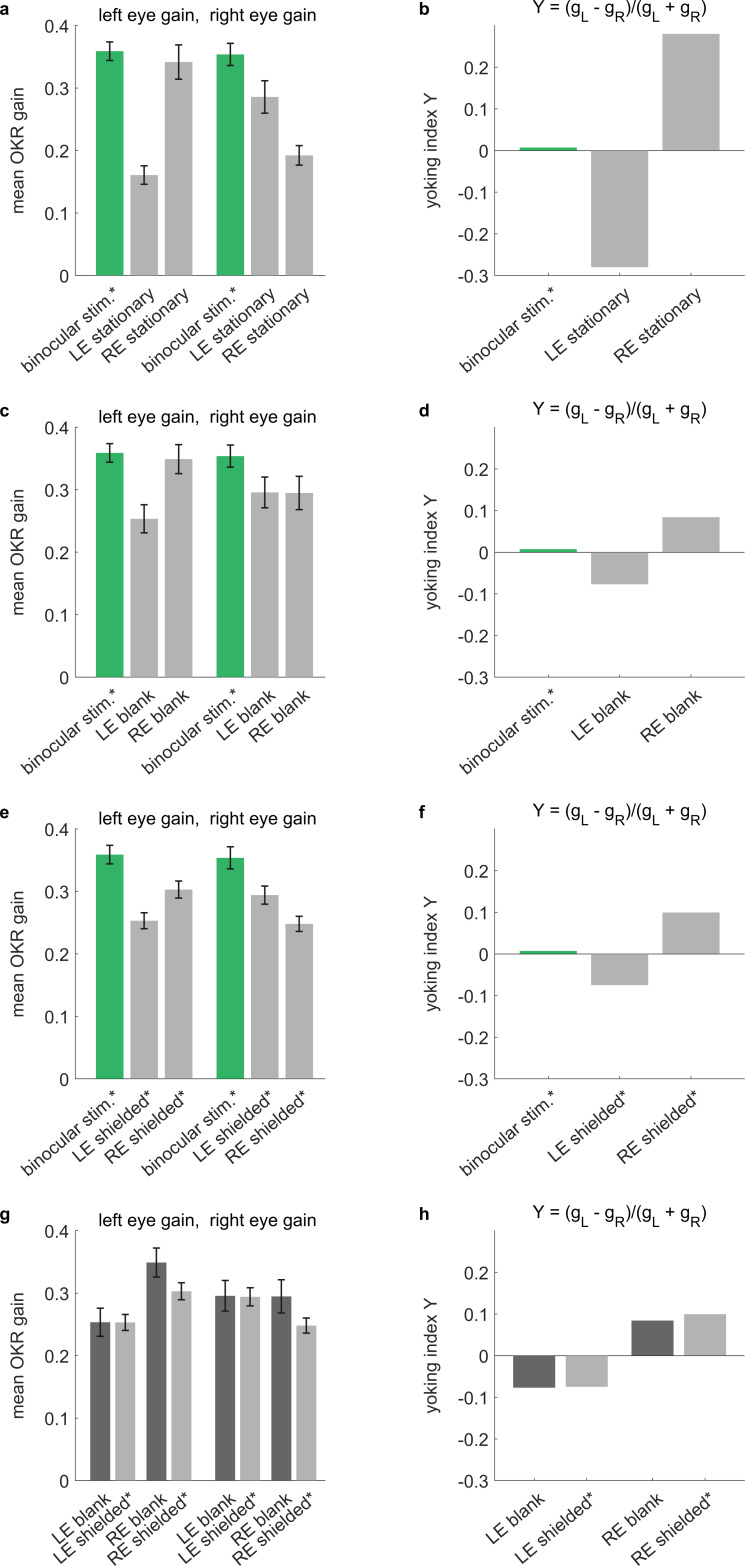
Figure 3—figure supplement 5. Across different types of arenas, stimulus reflections affect perceived yoking.

Figure 3—figure supplement 5.

Control experiments conducted in a rectangular stimulus arena. OKR-inducing gratings were shown on all four stimulus screens surrounding the larvae, while additional elements were introduced around either the left eye (LE), the right eye (RE) or neither. Specifically, selected eyes were (a,b) shown stationary stimuli of the same frequency and contrast as the moving stimuli, (c,d) shown a blank white surface, or (e,f) shielded with a fully opaque cover. See Supplementary file 1D for an overview of stimulus combinations. (a,c,e,g) Bars indicate mean OKR gains, and error bars show standard error of the mean. (b,d,f,h) Yoking indices are near zero when both eyes move with identical amplitudes and positive when left eye amplitude exceeds that of the right eye (see Materials and methods). (a,b) In the presence of two conflicting stimuli (moving vs. stationary), yoking between the eyes is reduced by almost half, confirming that the unstimulated eye is yoked to the stimulated eye, albeit with a lower OKR gain. (c,d) When there is no conflicting stimulus, yoking drives OKR of the contralateral eyes, albeit with a lower amplitude as if both eyes were stimulated directly with identical stimulus, (e,f) which is equally true in the presence of shielding. (g,h) To assess the effect of reflections on the difference between directly stimulated and purportedly stimulated eyes, we compare blank stimuli (as in c-d, which could diffusely reflect light) to fully shielded eyes (as in e-f, where no reflections should occur). There are no significant differences, indicating that the larger effect of reflections observed in our spherical arena (Figure 3—figure supplement 4) may be caused by the different stimulus design or by different reflection properties. *Two rectangular arena setups were used for the control experiments. Asterisks indicate data obtained from the second setup, for which balanced illumination was explicitly confirmed via diode photodetector. Data from n = 22 fish for initial setup and n = 10 fish for second setup.
Figure 3—video 1. Animation showcasing short samples of all disk stimuli used to study location dependence, as in Figure 3a.
Download video file (13.8MB, mp4)