. 2021 Jun 8;10:e63355. doi: 10.7554/eLife.63355

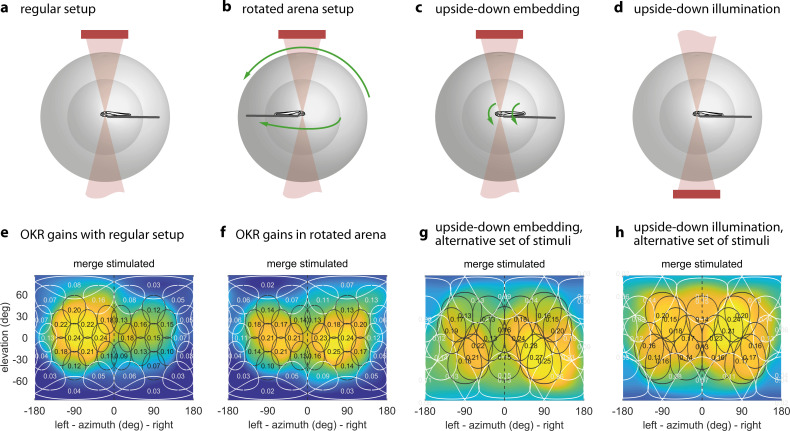
Figure 4. The OKR is biased towards upper environmental elevations irrespective of fish orientation.

(a) Regular arena setup. (b) Arena can be tilted 180 degrees so front and rear, upper and lower LED positions are swapped. The bulb holder moves accordingly, so from the perspective of the fish, left and right, upper and lower LEDs are swapped. (c) Upside-down embedding setup. (d) Setup with inverted optical path, including illumination. (e–h) Results in body-centred coordinates, where positive elevations refer to dorsal positions, for the four setups shown in (a–d). As in Figure 3b–e, colour indicates the discretely sampled OKR data filtered with a von Mises-Fisher kernel and follows a logarithmic colour scale. (g,h) Experiments with presentation of a less regularly distributed set of stimuli, cropped to disks of 64 degrees polar angle instead of the 40 degrees used in (a,b,e,f). (g) Fish embedded upside-down exhibit a slight preference for stimuli below the body-centred equator, that is, positions slightly ventral to their body axis. (h) Fish embedded upright, as in (a). To account for environmental asymmetries such as arena anisotropies, we combined the data underlying (e) and (f) to obtain Figure 3b–e (see Materials and methods). Data from (e) n = 7, (f) n = 5, (g) n = 3, (h) n = 10 fish.

Figure 4—source data 1. Numerical data and graphical elements of Figure 4e.
Figure 4—source data 2. Numerical data and graphical elements of Figure 4f.
Figure 4—source data 3. Numerical data and graphical elements of Figure 4g.
Figure 4—source data 4. Numerical data and graphical elements of Figure 4h.

Figure 4.

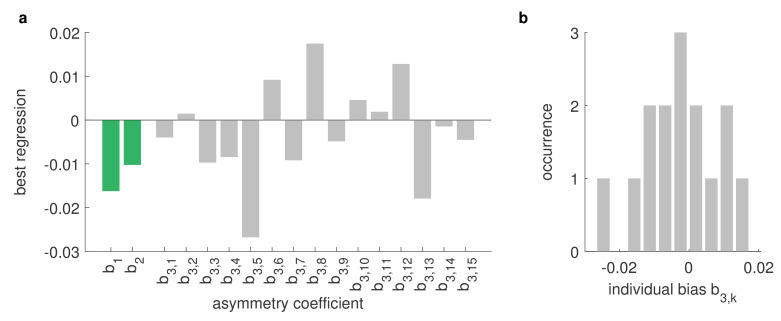
Figure 4—figure supplement 1. Asymmetries between left and right eye are strongly affected by the environment.

Figure 4—figure supplement 1

Differences between the OKR gains of directly stimulated left eyes and directly stimulated right eyes can be explained by a linear combination of biological and environmental factors, for example, biases of individual animals b3,k or asymmetries of the stimulus arena (see Materials and methods). Comparing data from the regular and rotated setups (Figure 4e–f), as well as data from fish immobilised upside-down (Figure 4g), including additional stimuli covering entire hemispheres (Supplementary file 1E), we can infer the underlying factors via multivariate regression of our linear model. We find that individual biases (grey) vary strongly from fish to fish and are broadly distributed from left to right. There are some constant biases across fish (green), both towards the left side of their visual field (b2) and towards one of the two LED hemispheres (b1); however, these biases are small and, given the large variability of individual biases, might be a result of the limited number of fish studied. Underlying stimulus types are listed in Supplementary file 1B and Supplementary file 1E. (b) Histogram of individual-fish biases shows no collective preference for either side.
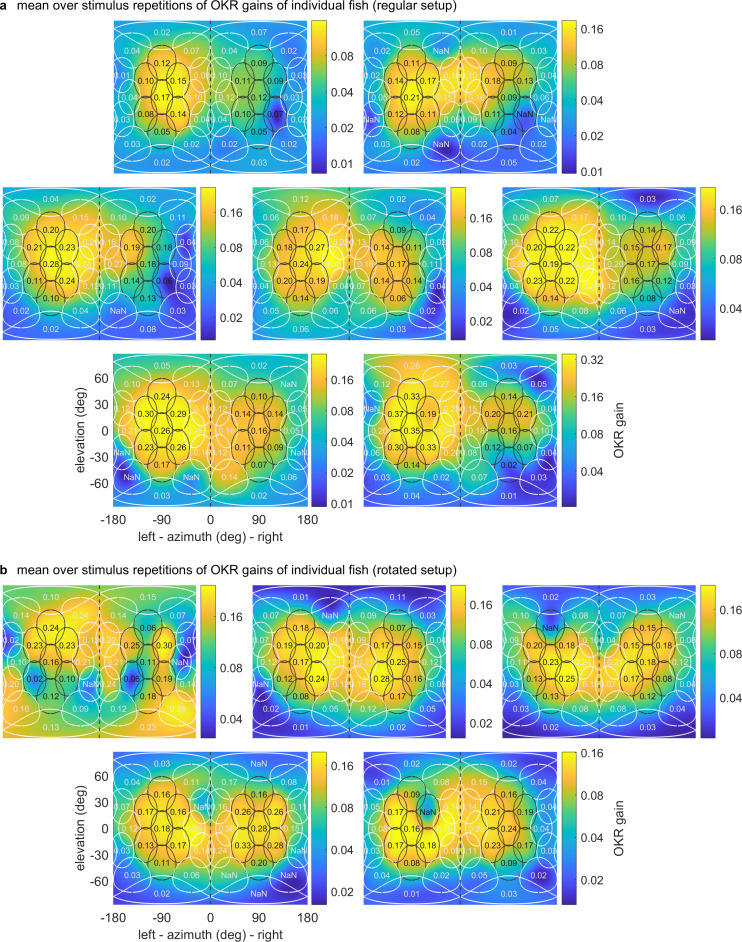
Figure 4—figure supplement 2. OKR gain maps for individual larvae.

Figure 4—figure supplement 2.

Mercator projections of OKR gain data as in Figure 3e and Figure 4e–h, but shown here for individual fish in (a) the regular setup, (b) the rotated arena. Data from n = 1 fish per panel. The results of the first fish in (b) are so irregular as to have likely been caused by experimenter error in preprocessing, rather than biologically meaningful differences. We thus excluded this fish from any analyses, such as the those for Figure 3 and Figure 4.
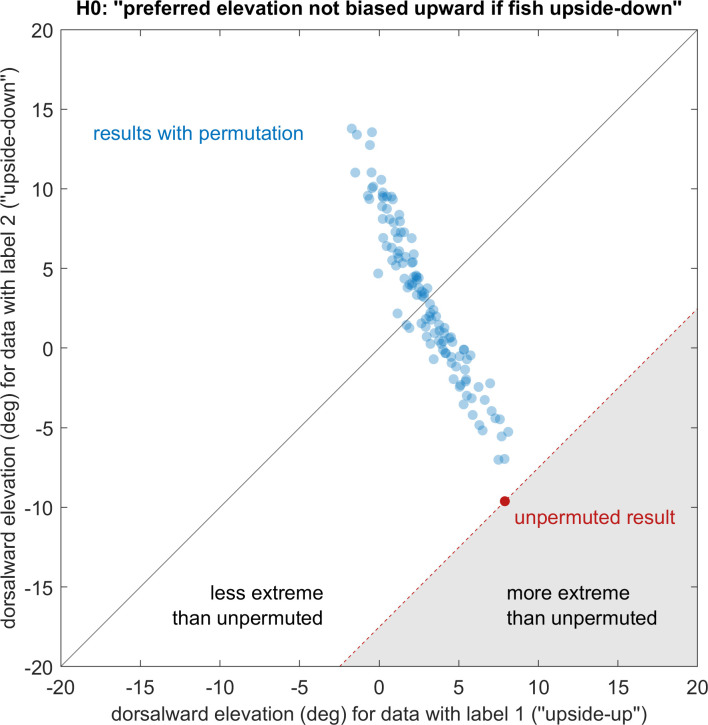
Figure 4—figure supplement 3. Elevation of stimuli evoking strongest OKR remains upward regardless of embedding direction.

Figure 4—figure supplement 3.

See Materials and methods for a detailed description of the permutation test. Showing the actual observation (red) and all 119 non-redundant permutations (blue) that maintain relative group size, p<0.05. ‘Dorsalward’ refers to the dorsal hemisphere in a body-centred reference frame, as opposed to the ‘upper’ hemisphere in an environmental reference frame. Before permutation, label one corresponds to the experiments shown in Figure 4a, whereas label two corresponds to those in Figure 4c. The test statistic is the signed distance from the black diagonal, with results in the white area being less extreme than those of the unpermuted observation. The null-hypothesis is rejected, so the elevation of OKR gain peaks within the visual field is not determined in body-centred coordinates, but instead biased towards upper elevations (‘towards the sun’, world-centred coordinates).