. 2021 Jun 8;10:e63355. doi: 10.7554/eLife.63355

Figure 5. OKR tuning to spatial frequency is similar across different visual field locations.

(a) Patterns with seven different frequencies were cropped to disks of a single size. These disks were placed in six different locations for a total of 42 stimuli. cpd: cycles per degree. (b) Patterns with identical spatial frequencies were cropped to disks of seven different sizes. These disks were also placed in six different locations for another set of 42 stimuli. Degrees indicate planar angles subtended by the stimulus outline, so 360° correspond to whole-field stimulation. (a, b) Displaying the entire actual pattern at the size of this figure would make the individual bars hard to distinguish. We thus only show a zoomed-in version of the patterns in which 45 out of 360 degrees azimuth are shown. (c) Coloured dots indicate the six locations on which stimuli from a and b were centred, shown from above (top), from front (middle), and from an oblique angle (bottom). (d) OKR gain is unimodally tuned to a wide range of spatial frequency (measured in cycles per degree). (e) OKR gain increases sigmoidally as the area covered by the visual stimulus increases logarithmically (a stimulus size of 1 corresponds to 100% of the spherical surface). (d–e) Colours correspond to the location of stimulus centres shown in (c). There is no consistent dependence on stimulus location of either frequency tuning or size tuning. Error bars show standard error of the mean. Data from n = 7 fish for frequency dependence and another n = 7 fish for size dependence.

Figure 5—source data 1. Numerical data and graphical elements of Figure 5.

Figure 5.

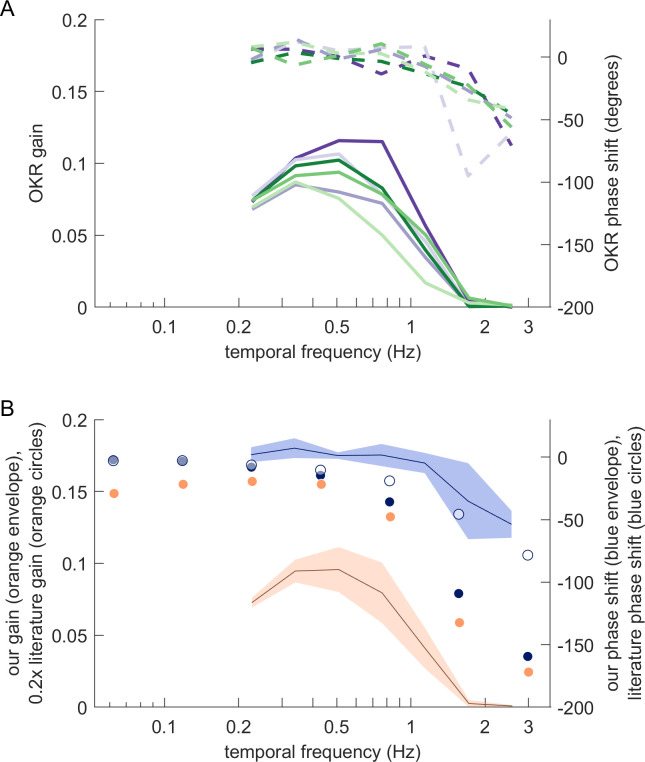
Figure 5—figure supplement 1. Magnitude and phase shift of eye movements at different frequencies resemble those previously observed for zebrafish OKR.

Figure 5—figure supplement 1.

(A) Bode plots showing OKR gain (solid lines) and phase shift relative to the stimulus (dashed lines). Gains and phase shifts decrease as temporal frequency increases. Each line represents the mean across trials for a specific stimulus location, pooled across all fish, all trials and both eyes. Colours match the stimulus locations identified in Figure 5c. (B) Our observations qualitatively, but not quantitatively, match those reported for traditional full-field stimulus paradigms. Solid blue circles represent OKR phase shifts for approximately 6.4 dpf zebrafish larvae reported by Beck et al., 2004. The blue line represents our own mean phase shift across all stimulus locations shown in (A), and the light blue envelope shows the standard deviation across locations. Interestingly, our phase shifts are more in line with those reported for older fish (approximately 33.8dpf larvae, open blue circles) in Beck et al., 2004. Solid orange circles show scaled OKR gain for approximately 6.4dpf zebrafish larvae, as reported by Beck et al., 2004. Direct comparison to our gain data could be misleading because of the smaller size and higher velocity of our stimuli. Based on our results reported in Figure 5e, the size difference alone should account for a factor of about 5. Orange circles thus show the literature gain data scaled 0.2x. The black line and orange envelope represent our mean OKR gain and standard deviation across all stimulus locations shown in (A). Quantitative changes are consistent with the notion that smaller and faster stimuli evoke equally reliable, but lower-amplitude OKR behaviour (Figure 2c).
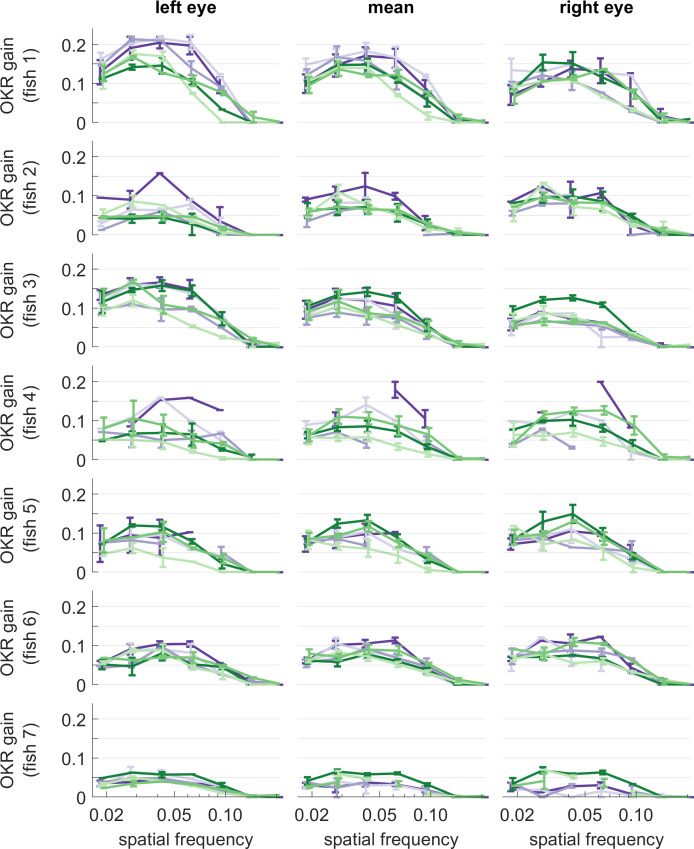
Figure 5—figure supplement 2. OKR gain of individual larvae, for different stimulus frequencies.

Figure 5—figure supplement 2.

Same colours as in Figure 5. Error bars show standard error of the mean. Data from n = 7 fish.
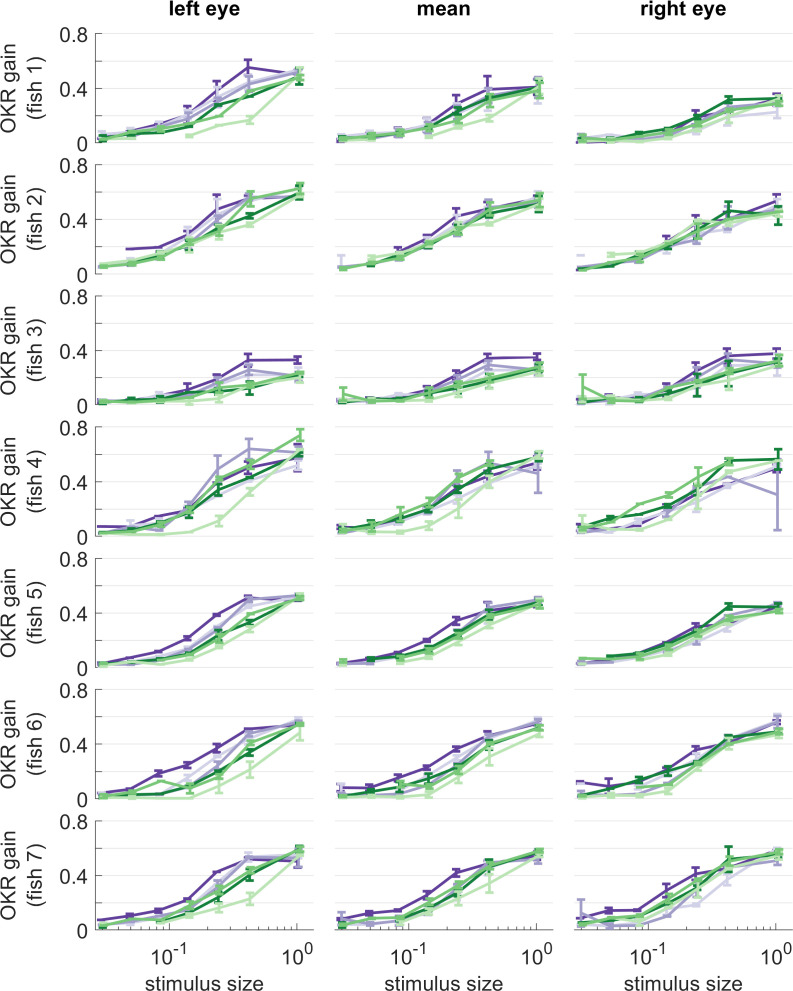
Figure 5—figure supplement 3. OKR gain of individual larvae, for different stimulus sizes.

Figure 5—figure supplement 3.

Same colours as in Figure 5. Error bars show standard error of the mean. Data from n = 7 fish.
Figure 5—video 1. Animation showcasing short samples of all disk stimuli used to study frequency dependence, as in Figure 5a.
Download video file (18.6MB, mp4)
Figure 5—video 2. Animation showcasing short samples of all disk stimuli used to study size dependence, as in Figure 5b.
Download video file (52.2MB, mp4)