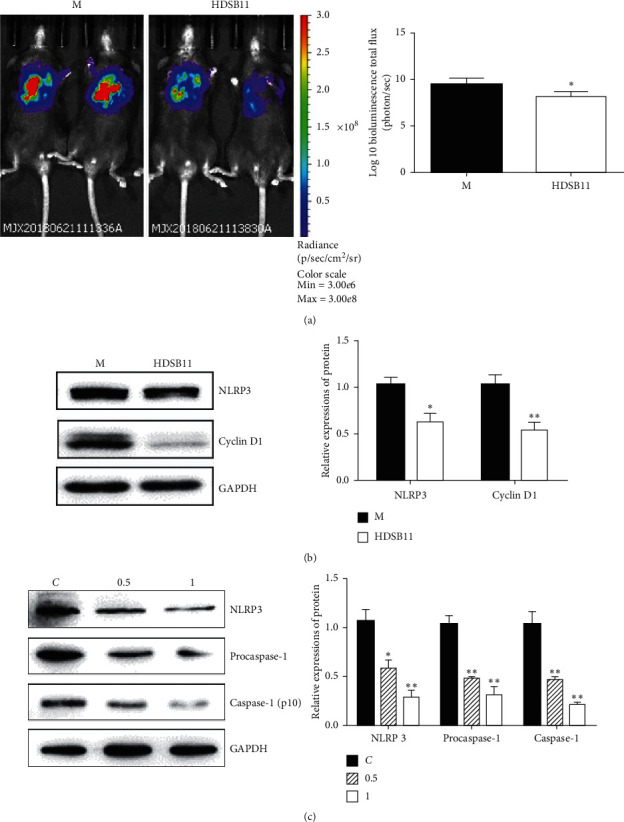
Figure 3.

Effect of HDSB11 on tumor growth in vivo and expressions of NLRP3 in tumor tissues and cells. (a) In vivo imaging map and value; (b) NLRP3 and cyclin D1 protein expressions in tumor tissues. (c) Expressions of NLRP3, procaspase-1, and caspase-1 (p10) protein in cells. Compared with the M or C group, ∗P < 0.05 and ∗∗P < 0.01.
