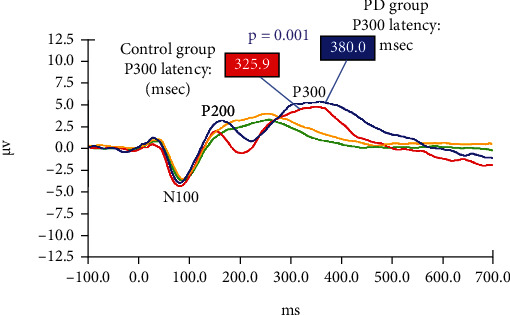
Figure 1.

Grand averaged AERPs from both study groups in response to target (1000 Hz) and nontarget (500 Hz) tones during the “oddball” paradigm. Red: control group response to target tones; Green: control group response to nontarget tones; Blue: PD group response to target tones; Yellow: PD group response to nontarget tones.
