Figure 4. .
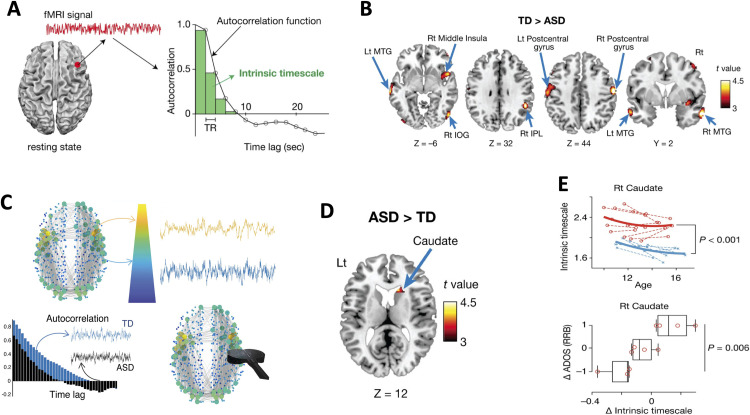
Atypical intrinsic neural timescale in autism. (A) Estimated neural timescale from fMRI BOLD signal, based on sum of autocorrelation function. (B) Intrinsic neural timescales are plotted in bilateral middle insula, pre- and postcentral gyrus (exhibiting shorter timescales). (C) Brain core regions located at the top of the hierarchy are shown in large (yellow) circles and have longer timescales. Brain regions located at the periphery are represented by small (blue) circles and have shorter timescales. Individuals with autism spectrum disorders (ASD, black) have different intrinsic timescales (quantified by the autocorrelation function) compared with typically developing individuals (TD, blue). A schematic displays that noninvasive brain stimulation (black coil) may be used to selectively modulate atypical brain regions to restore their intrinsic timescales. (D) Intrinsic neural timescales in the right caudate are longer in the ASD group compared with the TD group. (E) The intrinsic neural timescale in the right caudate is plotted as a function of age in TD (blue) and ASD (red) during adolescence and the correlation of intrinsic neural timescales with progression of RRB symptoms. Autocorrelation function, ACF; typically developing, TD; autism spectrum disorder, ASD. Figure adapted with permission from Watanabe et al. (2019).

