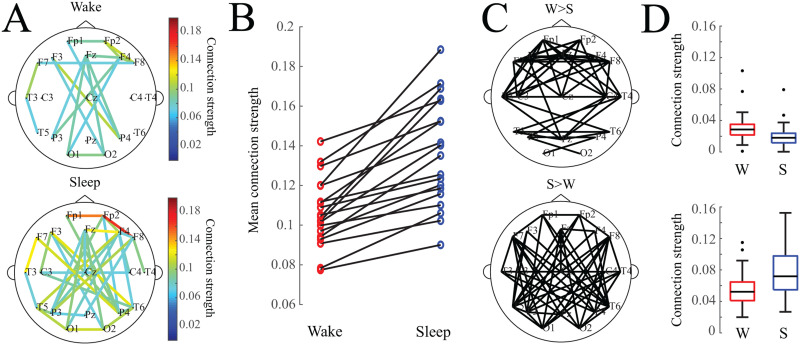
Figure 1. .
(A) Average functional connectivity networks for wakefulness and sleep. For visualization, an edge is drawn if the connection value exceeds an absolute threshold of 0.075. (B) Mean connection strength for individual subjects (calculated as the average strength of the strongest 10% of connections) is higher during sleep. (C) Network maps showing connections that were statistically significantly greater in wakefulness (top) or sleep (bottom). (D) Box plots of mean connection strength for connections that were significantly different between wakefulness and sleep (shown in subfigure C).

